Results
Two Δ4-3-ketosteroid 5β-reductases were taken forward for engineering: human AKR1D1 and the bacterial enzyme ci2350 from Clostridium innocuum. Of the two, only ci2350 offered a route to testosterone selectivity, whereas in AKR1D1 the engineered residues sit too far from C17 to distinguish the two steroids, and every substitution moved both ligands equally. R215A + V263I emerged as the strongest ci2350 design, weakening progesterone binding while keeping testosterone affinity and structural stability intact, and the mathematical model predicted a 2-fold testosterone preference under realistic kinetic and expression conditions, setting the benchmark for the wet lab. Expression work ran in parallel: AKR1D1 reached at best 37 ± 4% solubility with TrxA at 0.2 mM IPTG but was never purified or assayed, while ci2350-MBP was recovered by IMAC, though every eluate carried persistent ~38 kDa and ~70 kDa contaminants and the induced empty-vector control gave about three-quarters as much total protein by Bradford. In the final NADH-based activity assay, the wild-type ci2350-MBP testosterone-containing reaction and the no-substrate control showed nearly identical absorbance decreases (12.6% vs 12.5%), so even baseline activity could not be confirmed, leaving the predicted 2-fold preference of R215A + V263I untested. Cleaner preparations, matched controls, and direct LC–MS/MS quantification of steroid conversion will be needed to close the loop between the computational predictions and experimental evidence.
Enzyme specificity engineering
The aim was to shift substrate preference towards testosterone and away from progesterone, two steroids that differ only at the C17 substituentThe chemical group attached to carbon 17 of the steroid ring system, where testosterone and progesterone differ..
Structures were obtained from the PDBProtein Data Bank, a public database of experimentally determined protein structures. (AKR1D1, 3CAV) and from AlphaFoldAn AI program that predicts a protein's 3D structure from its amino acid sequence. (ci2350), and the functional pocket in each was located with fpocketSoftware that finds cavities (pockets) on a protein's surface where molecules could bind. and confirmed against NCBI CD SearchA tool that matches a protein sequence to known protein domains and marks their key positions. annotations. DockingA computer simulation that predicts how well a molecule fits into a protein's binding site. both substrates into the wild-typeThe natural, unmodified version of an enzyme. enzymes gave similar absolute affinities but opposite preferences: AKR1D1 favored progesterone by 0.5 kcal/mol, while ci2350 showed a marginal testosterone preference of 0.1 kcal/mol, within the scoring noise.
Residues within 4 ÅAngstrom: unit of length equaling 10^−10 m of each docked ligand were sorted by which substrate they contacted. This identified three specificity determinants in AKR1D1 (V309, L311, I57) and six in ci2350 (A107, R215, V263, V59, F71, Q100). Substitutions at these positions were designed to weaken progesterone binding or strengthen testosterone binding, then screened for structural stability in PyRosettaSoftware for modeling protein structures and predicting how mutations change their stability.. Of 24 AKR1D1 variants, 13 passed the +5 REU threshold; of 31 ci2350 variants, 17 passed. These variants were then docked with both substrates to assess their specificity towards testosterone.
The full workflow for both AKR1D1 and ci2350, from protein structure acquisition through to mutant docking, is described on the Model page.
Docked poses of the AKR1D1 variants
Thirteen stable AKR1D1 variants were docked with both steroids. Selectivity is reported as , so a positive value means progesterone is bound more tightly; the wild type sits at +0.5 kcal/mol. A variant improves only if this value falls.
| Mutation | Progesterone (kcal/mol) | Testosterone (kcal/mol) | Selectivity (ΔGT − ΔGP) | ΔΔG (REU) |
|---|---|---|---|---|
| WT (reference) | −9.8 | −9.3 | +0.5 | Baseline |
| V309T | −9.9 | −9.4 | +0.5 | −2.29 |
| V309S | −9.8 | −9.4 | +0.4 | −0.8 |
| V309E | −9.8 | −9.4 | +0.4 | −3.29 |
| L311S | −9.9 | −9.4 | +0.5 | −3.19 |
L311T | −9.9 | −9.4 | +0.5 | −1.91 |
L311Y | −10.0 | −9.5 | +0.5 | −1.68 |
L311F | −9.9 | −9.4 | +0.5 | −0.95 |
L311E | −9.9 | −9.4 | +0.5 | −2.42 |
I57S | −10.4 | −9.8 | +0.6 | +4.23 |
I57N | −10.6 | −9.7 | +0.9 | +2.69 |
I57Y | −9.8 | −9.4 | +0.4 | 0.0 |
Combo 1: V309T + L311S | −9.9 | −9.4 | +0.5 | −3.44 |
Combo 6: V309T + L311S + I57S | −10.4 | −9.8 | +0.6 | +0.80 |
No variants shifted the preference. The largest gain was 0.1 kcal/mol, far below the ±0.5 kcal/mol noise of the scoring functionThe formula the docking software uses to estimate how strongly a molecule binds., so V309S, V309E and I57Y cannot be called improvements. The only changes large enough to read as real went the wrong way: I57N moved the preference 0.4 kcal/mol further towards progesterone.
The mutations alter how well the pocket holds a steroid, not which steroid it holds. Testosterone and progesterone differ only at C17, and if a substitution cannot distinguish that one group, it will always move both ligands together.
Two substitutions were examined in detail: V309T, which replaces a valine methyl group with the hydroxylAn -OH group: an oxygen atom bonded to a hydrogen atom. of threonine, and L311S, which trims a leucine side chain down to serine. Both were intended to introduce polarity near the steroid and make the pocket less comfortable for progesterone's acetyl groupA small group of atoms (CH3-C=O) attached at C17 in progesterone.. Both sit above the plane of the progesterone, over the B and C rings, while the C17 substituent extends past them into the open end of the pocket (Figure 1, Figure 2, Figure 3 and Figure 4).
Since neither mutated side chain reaches the C17 group, there is no direct contact. So, an acetyl group and a hydroxyl look the same to the enzyme, which matches the docking scores: every substitution at these positions moved both substrates by the same amount, leaving the selectivity gap at +0.5 kcal/mol.
AKR1D1 was therefore not carried forward due to reduced specificity. Engineering specificity here would need side chains long enough to reach C17 from these positions, or a different set of positions closer to it.
Docking poses of ci2350 variants
Seventeen stable ci2350 variants were docked with both steroids. Selectivity is again , so a negative value means testosterone is bound more tightly. The wild type sits at −0.1 kcal/mol, a marginal preference that is within scoring noise.
| Mutation | Progesterone (kcal/mol) | Testosterone (kcal/mol) | Selectivity (ΔGT − ΔGP) | ΔΔG (REU) | Recommendation |
|---|---|---|---|---|---|
| Wild type (reference) | −9.1 | −9.2 | −0.1 | Baseline | Reference |
| Combo 8: R215A + V263I | −8.5 | −9.4 | −0.9 | +1.42 | TOP PRIORITY – highest selectivity, enhanced test affinity, neutral stability |
| Combo 13: R215A + V263I + Q100T | −8.0 | −8.5 | −0.5 | −7.19 | HIGH PRIORITY – strong selectivity, strongly stabilizing |
| V263K | −6.9 | −7.4 | −0.5 | +2.21 | HIGH PRIORITY – strong selectivity, single-point mutation |
| Combo 9: R215E + V263I | −7.4 | −7.7 | −0.3 | +4.84 | Good selectivity, borderline stability |
V263D | −9.1 | −9.3 | −0.2 | +1.36 | Conservative – full affinity maintained, neutral stability |
V59S | −9.0 | −9.2 | −0.2 | −2.36 | Conservative – full affinity maintained, stabilizing |
V263E | −7.4 | −7.6 | −0.2 | +2.36 | Good selectivity, mild instability |
V263I | −7.4 | −7.6 | −0.2 | +4.96 | Good selectivity, borderline stability |
Combo 7: R215E + V263E | −7.4 | −7.6 | −0.2 | +2.28 | Good combo, mild instability |
Combo 8 (R215A + V263I) is the only variant that moved the preference by more than the ±0.5 kcal/mol noise, shifting it 0.8 kcal/mol from the wild type, and the combination is structurally well tolerated (ΔΔG = +1.42 REURosetta Energy Units, the score for how stable a protein structure is. Lower is more stable.). It is also the only one that does so without giving up affinity (Table 2): progesterone at −8.5 and testosterone at −9.4 are close to the wild-type values, so the gap comes from holding testosterone more tightly rather than from binding everything more weakly.
R215 makes a direct contact with the C17 acetyl tail of progesterone, so replacing it with alanine removes a stabilizing interaction that only progesterone uses (Figure 5 and Figure 6). V263I works on the same region from the other side: isoleucine is bulkier than valine and appears to crowd the acetyl tail, while testosterone, which carries only a compact 17β-hydroxyl at that position, fits the branched side chain more comfortably and binds slightly better.
The two mutations behave very differently on their own. V263I shifts the preference by only −0.2 selectivity and weakens progesterone binding to −7.4 kcal/mol, so the gain in Combo 8 has to come from removing the arginine at 215 (Table 2).
Combo 13 (R215A + V263I + Q100T) adds Q100T to the Combo 8 backbone (Figure 7 and Figure 8). Q100T offers the same hydrogen-bonding capacity from a shorter side chain. In combination the variant reaches ΔΔG = −7.19 REU, the most stable candidate in the set, which helps in obtaining enough soluble protein to characterize. The cost is selectivity: the preference falls to −0.5 kcal/mol, within the noise floor. Combo 13 is therefore the safer choice if stability proves limiting, rather than the better one on specificity.
V263K also reaches −0.5 kcal/mol selectivity, but by a different route. The long lysine side chain is poorly suited to the hydrophobicWater-repelling: such groups prefer to sit next to other nonpolar groups. end of the pocket and weakens binding of both steroids substantially (Figure 9 and Figure 10), progesterone from −9.1 to −6.9 and testosterone from −9.2 to −7.4, with progesterone penalized more. The preference comes from making the pocket worse for everything rather than from distinguishing the two substituents. As a single substitution, it is simple to make and characterize, which keeps it on the list, but the affinity loss limits its usefulness.
Overall, docking showed that AKR1D1 cannot be engineered towards testosterone with the positions identified. Every substitution moved both steroids by the same amount, because none of the mutated side chains reaches the C17 group, and the selectivity stayed at about +0.5 kcal/mol. In ci2350, R215A + V263I was the only variant to shift the preference beyond the scoring noise (−0.1 to −0.9 kcal/mol), with testosterone affinity kept and stability neutral. R215A + V263I + Q100T is the more stable fallback, and V263K is a simple single-point option that loses affinity. R215A + V263I was therefore taken into the activity modeling (Model) and prioritized for experimental design (Parts).
Modeling enzyme production and activity
Overview
The aim was to predict how much enzyme a culture produces, and what that enzyme does once both steroids are present. Three layers were built and run as one system: a growth model for the culture, an expression model for how much enzyme each cell carries, and an activity model for how the enzyme divides its time between testosterone and progesterone.
Growth follows a logistic curveA growth curve that starts exponential and levels off as the culture fills its container. fitted to our own OD600 measurements, which sets the maximum growth rate, the carrying capacityThe maximum culture density that the medium can support. and the starting density. Expression covers transcription, translation and dilution by growthAs cells divide, the enzyme in each cell is shared between the two daughters, which lowers its concentration.. The activity layer treats the two steroids as competing for a single active site, so the preference predicted from docking determines which one is turned over.
Because this layer depends on binding, it is tied to the specificity work. Since AKR1D1 showed no useful shift in preference, the activity model was run for ci2350 and its variants, mainly on R215A + V263I, using Michaelis constantsThe substrate concentration at which an enzyme works at half its top speed (Km). Lower means tighter binding. derived from the docking scores.
Most parameters are literature values rather than measurements from our own strain, so the model was tested rather than taken at face value. Each was varied by ±20% one at a time to see which ones the output depends on, and a Monte Carlo analysis drew all of them at random together to check whether the conclusions hold across the plausible range. The results of both analyses are reported below.
The full description of the three layers, their equations, and assumptions is on the Model page.
Prediction of integrated enzyme production model
Baseline behavior
With the baseline parameters, the culture reaches OD600 = 0.5 at 1.58 h, which is the induction point, and 99% of its carrying capacity (K = 15) at 6.96 hr. mRNA rises almost immediately after induction and reaches 99% of its steady state () within 0.48 hr. Enzyme builds up more slowly. Per cell, it reaches 4.9 relative units when growth saturates and then keeps rising almost linearly to 31.7 at 24 hr. After growth stops, dilution is almost zero, so everything translated from the still-present mRNA stays in the cell (Figure 11).
This baseline result shapes the sweeps that follow. The enzyme level is set mainly by the mRNA supply (α, δm) and the translation rate (β), while growth acts mostly through dilution.
Sensitivity to individual parameters
Each parameter was swept by ±20% with all others held at baseline, and the change in the final value at 24 hr was recorded and compared with the baseline result (Table 3).
| Parameter | Biomass | mRNA | Enzyme per cell |
|---|---|---|---|
| α (transcription) | 0% | ±20% | ±20% |
| β (translation) | 0% | 0% | ±20% |
| δm (mRNA decay) | 0% | +25% / −17% | +25% / −17% |
| µmax | 0% | 0% | −4.8% / +3.2% |
| K | ±20% | 0% | +0.7% / −0.6% |
In the sweeps, the amount of enzyme in each cell follows the mRNA supply, while the growth parameters mostly decide how many cells there are. Transcription (α) and mRNA decay (δm) set the mRNA pool through , and the enzyme follows that pool. A 20% change in α changes mRNA and enzyme by the same 20%, and biomass is unaffected (Figure 12 and Figure 13). The response to δm is not symmetric, because mRNA falls as : a 20% lower decay rate raises the enzyme by 25%, while a 20% higher one lowers it by 17%.
Growth parameters play a much smaller role. K sets only how large the culture becomes, so the biomass changes by exactly ±20% while the enzyme per cell stays within 1%. µmax changes the enzyme per cell by only −4.8% to +3.2%, and it leaves final biomass and mRNA unchanged. These minor biomass effects are due to the dilution of enzyme with growth (Figure 14 and Figure 15).
Together, these results show that each cell's own expression machinery (transcription, mRNA lifetime and translation) decides how much enzyme it holds, while growth decides how many cells there are. The total enzyme in the culture is enzyme per cell multiplied by biomass, which changes with K. Consequently, the expression parameters, especially the poorly known mRNA half-life, change enzyme production strongly by more than 2.5-fold during sweep analysis, which requires careful experimental design.
Expression uncertainty
To ask how much the enzyme level could vary if all inputs are uncertain, three Monte Carlo analyses were run with 500 draws each, sampling parameters with a 10% standard deviation around their baseline values.
When only the growth parameters (K, µmax) were varied, the final enzyme stayed in a narrow band (−4% to +3% change) around the baseline, due to the dilution effect (Figure 16). When only the expression parameters (α, δm) were varied, the spread was much wider (Figure 17). Varying all four together gave almost the same spread as seen from the expression parameters, which means uncertainty in growth hardly matters (Figure 18). From the uncertainty, the estimated enzyme was around 31 relative units per cell.
Biologically, how much enzyme each cell makes depends mainly on how much mRNA it produces and how long that mRNA lasts, while the size of the culture adds little uncertainty. Because a ±10% variation in the mRNA half-life is much narrower than the reported 3–8 min range, the real uncertainty is probably larger than shown here, so the enzyme values should be treated as relative until the expression parameters are measured.
Overall, enzyme production is controlled mainly by the expression parameters (α, δm), not by growth, and the mRNA half-life is the biggest uncertainty (about 2.5-fold across 3–8 min), so expression conditions need careful control and measurement.
Prediction of activity model
To predict how the engineered enzyme would behave in the cell, the expression model was linked to a competitive Michaelis–Menten model of testosterone and progesterone conversion. This section tests R215A + V263I, the variant selected in the Enzyme specificity engineering results. We first show the baseline run and then test how robust it is to the expression and growth settings, the kcatThe turnover number: how many substrate molecules one enzyme converts per second when fully busy. ratio, the docking scores, and random errors in all of them together. Throughout, the speed ratio measures which steroid is converted first.
Baseline and sweep effect on enzyme activity
For R215A + V263I, the culture reaches OD 0.5 and is induced at 1.58 hr. Enzyme per cell then rises to about 3 relative units by 5.58 hr, when both steroids are added at 50 µM. By then the culture is close to its maximum density (about OD 14). After substrate addition, testosterone is consumed first and is nearly gone within about 1.1 hr, with progesterone following within about 1.4 hr (Figure 19). The half-times (t50) are 29.1 min for testosterone and 58.5 min for progesterone, a speed ratio of 2.0 in favor of testosterone.
Anything that increases the total amount of enzyme in the flask makes both steroids disappear faster without changing which one goes first. The total enzyme depends on the number of cells, transcription (α), translation (β), kcat, E_scale, growth rate (µmax), culture density (K) and later induction. So, while sweeping each parameter, the effects were shown in the Table 4.
| Parameter swept | Range tested | Testosterone t50 (min) | Progesterone t50 (min) | Speed ratio [t50(P)/t50(T)] |
|---|---|---|---|---|
| α (transcription) | 1.25 → 20 | 92.5 → 8.0 | 166.8 → 17.2 | 1.80 – 2.16 |
| β (translation) | 1.2 → 36 | 63.8 → 2.7 | 119.3 → 6.0 | 1.87 – 2.21 |
| µmax (growth rate, h⁻¹) | 0.74 → 2.22 | 64.7 → 21.8 | 114.4 → 45.5 | 1.77 – 2.09 |
| K (carrying capacity, OD600) | 5 → 30 | 58.9 → 19.5 | 114.4 → 39.7 | 1.94 – 2.03 |
| Induction OD600 | 0.3 → 1.0 | 34.0 → 24.2 | 66.3 → 49.9 | 1.95 – 2.07 |
Across every sweep the testosterone t50 changed from 2.7 to 92.5 min, while the speed ratio stayed between 1.8 and 2.2 (Table 4 and Figure 20). Here, growth mattered as much as expression because total enzyme depends on the culture density.
But what determines the enzyme's preference between the two steroids is the binding energy and the turnover number (kcat). A ±0.3 kcal/mol shift in the progesterone docking score changes the speed ratio. Among all the variants, R215A + V263I stayed the most testosterone-selective with minor variation (Figure 21). Similarly, when the turnover-rate (kcat) ratio () was altered, R215A + V263I still favored testosterone even at the lower ratio (Figure 22).
Uncertainty of activity
Each docking score (progesterone and testosterone) was drawn with a standard deviation of 0.5 or 1.0 kcal/mol, together with broad random draws of the expression and kinetic parameters (α, β, E_scale, kcat and the Km anchor), 200 draws per enzyme. Every draw was compared with the wild type from the same draw, and the wild type itself served as a noise-only control.
The distributions of both speed ratio and selectivity score of docking of the R215A + V263I variant favored testosterone much more strongly than the other variants and wild type (Figure 23 and Figure 24). V263K has a long tail towards high ratios (95th percentileThe value below which 95% of the results fall. 6.7 at 1.0 kcal/mol), because its Km values are large and uncertain (Figure 23).
R215A + V263I is the most promising variant. Its docking-based Km values predict a testosterone preference. This preference is the least affected by a ±0.3 kcal/mol docking shift, and the variant survives the random-error draws against the WT control. Expression and growth settings change how fast the steroids are consumed, but binding energy shows which steroid is preferred first. The ranking is still a prediction, because the kcat ratio is unknown and docking error is larger than most differences between variants.
Establishing expression constructs
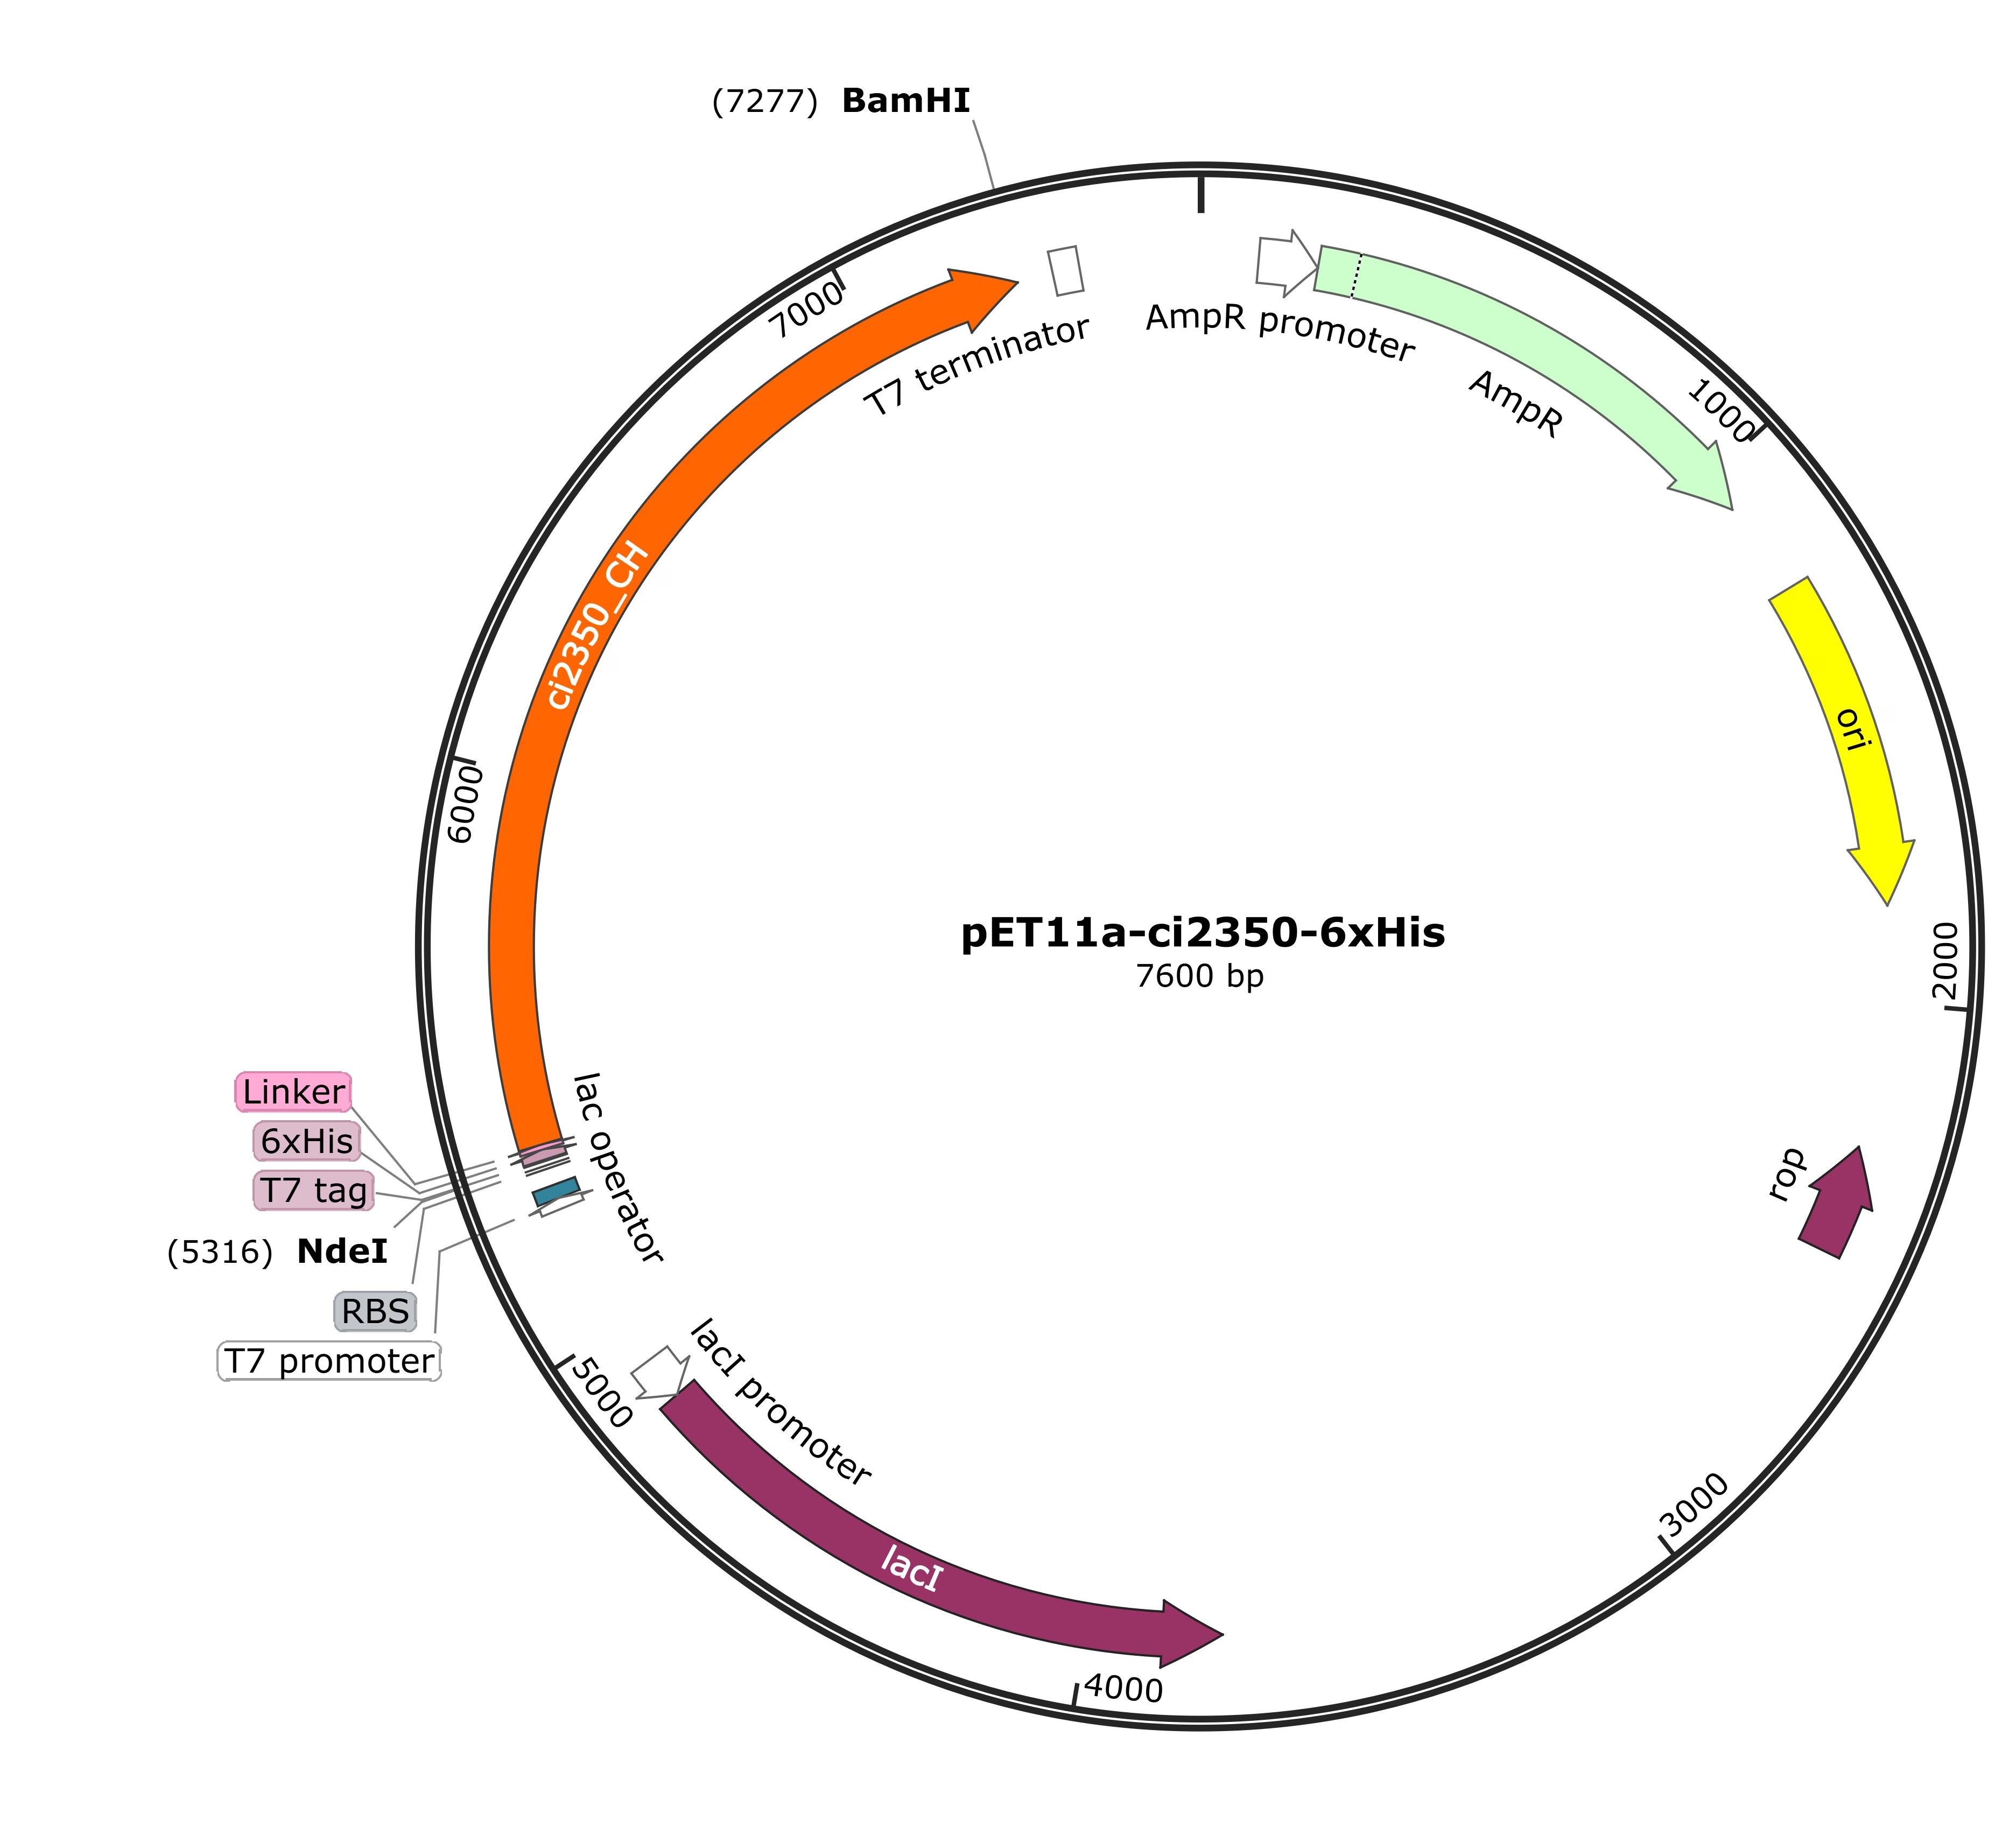
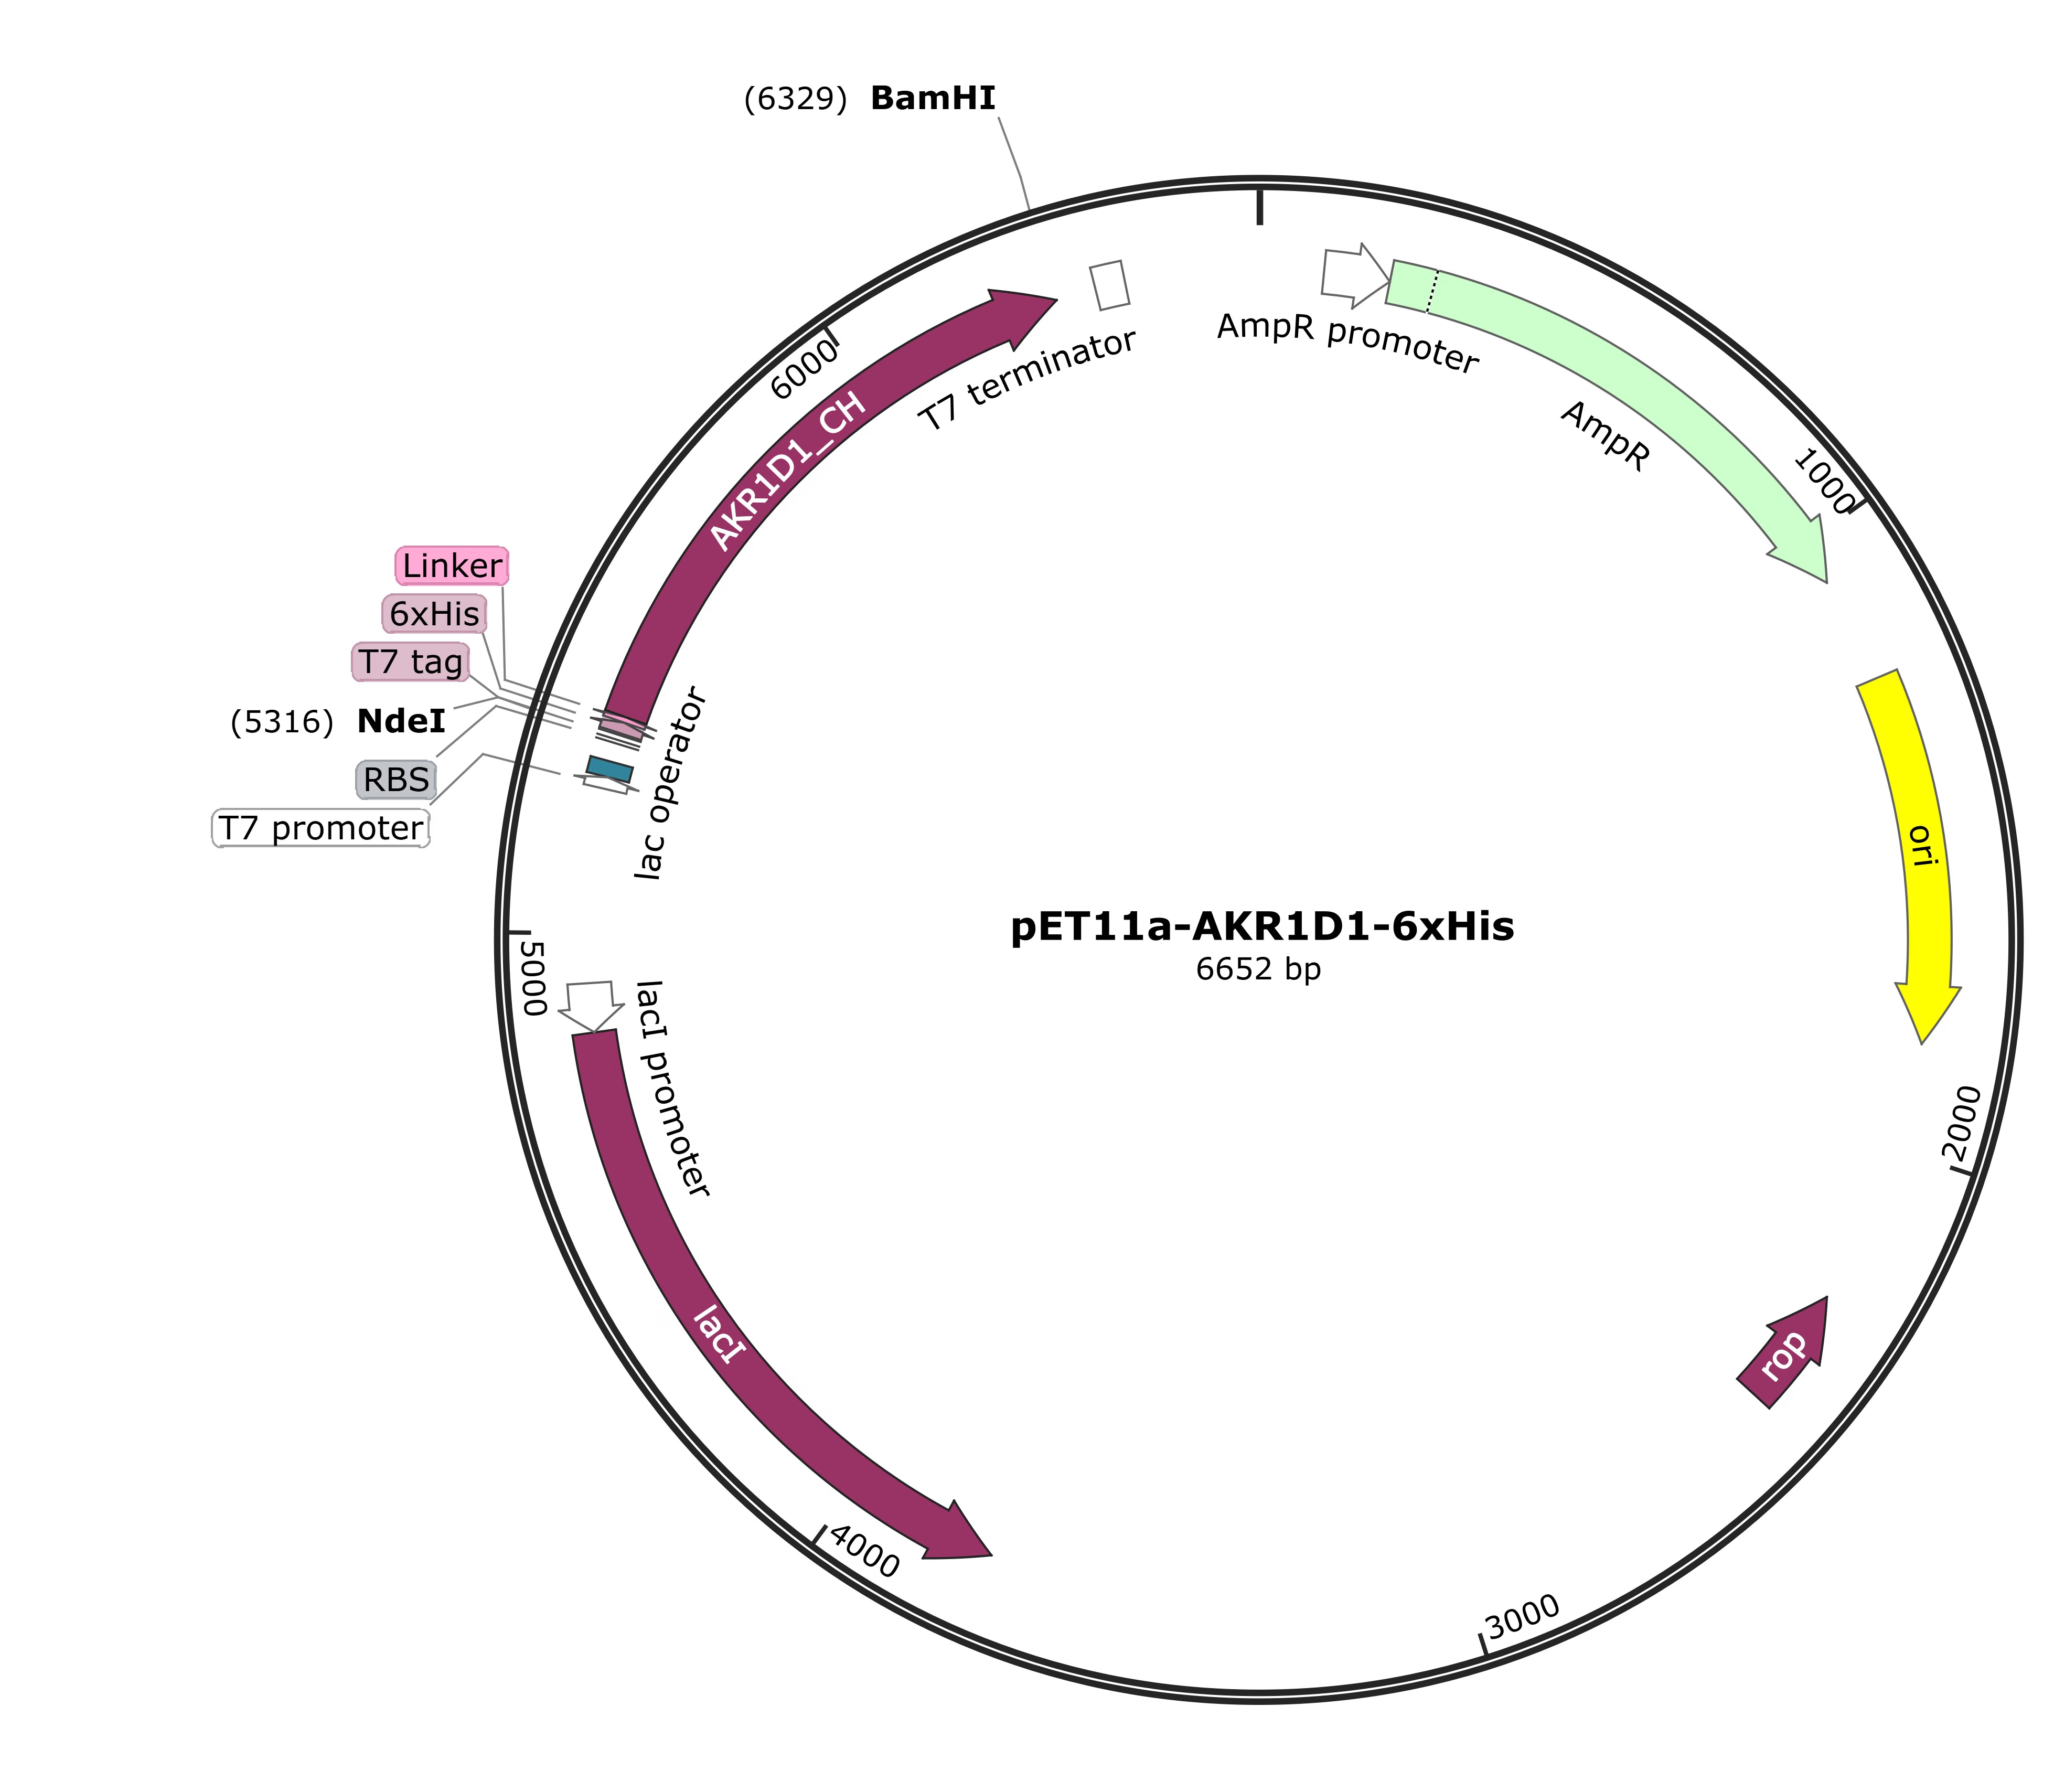
To test these computational predictions experimentally, both AKR1D1 and ci2350 needed to be expressed as soluble, active protein. Therefore, before expressing the two 5β-reductases in Escherichia coli BL21(DE3), we codon-harmonized the AKR1D1 (human origin) and ci2350 (from Clostridium innocuum).
We then ordered the following parts as gBlocksSynthetic double-stranded DNA fragments ordered from a supplier. from IDT:
- ci2350-6xHis (BBa_26BLGGCH)
- AKR1D1-6xHis (BBa_267YYAV3)
- ci2350-SUMO-6xHis (BBa_262WHKTK)
- ci2350-TrxA-6xHis (BBa_262Y2YB5)
- AKR1D1-MBP-6xHis (BBa_26FG0OLP)
- AKR1D1-SUMO-6xHis (BBa_269RW54U)
- AKR1D1-TrxA-6xHis (BBa_26EE7O9A)
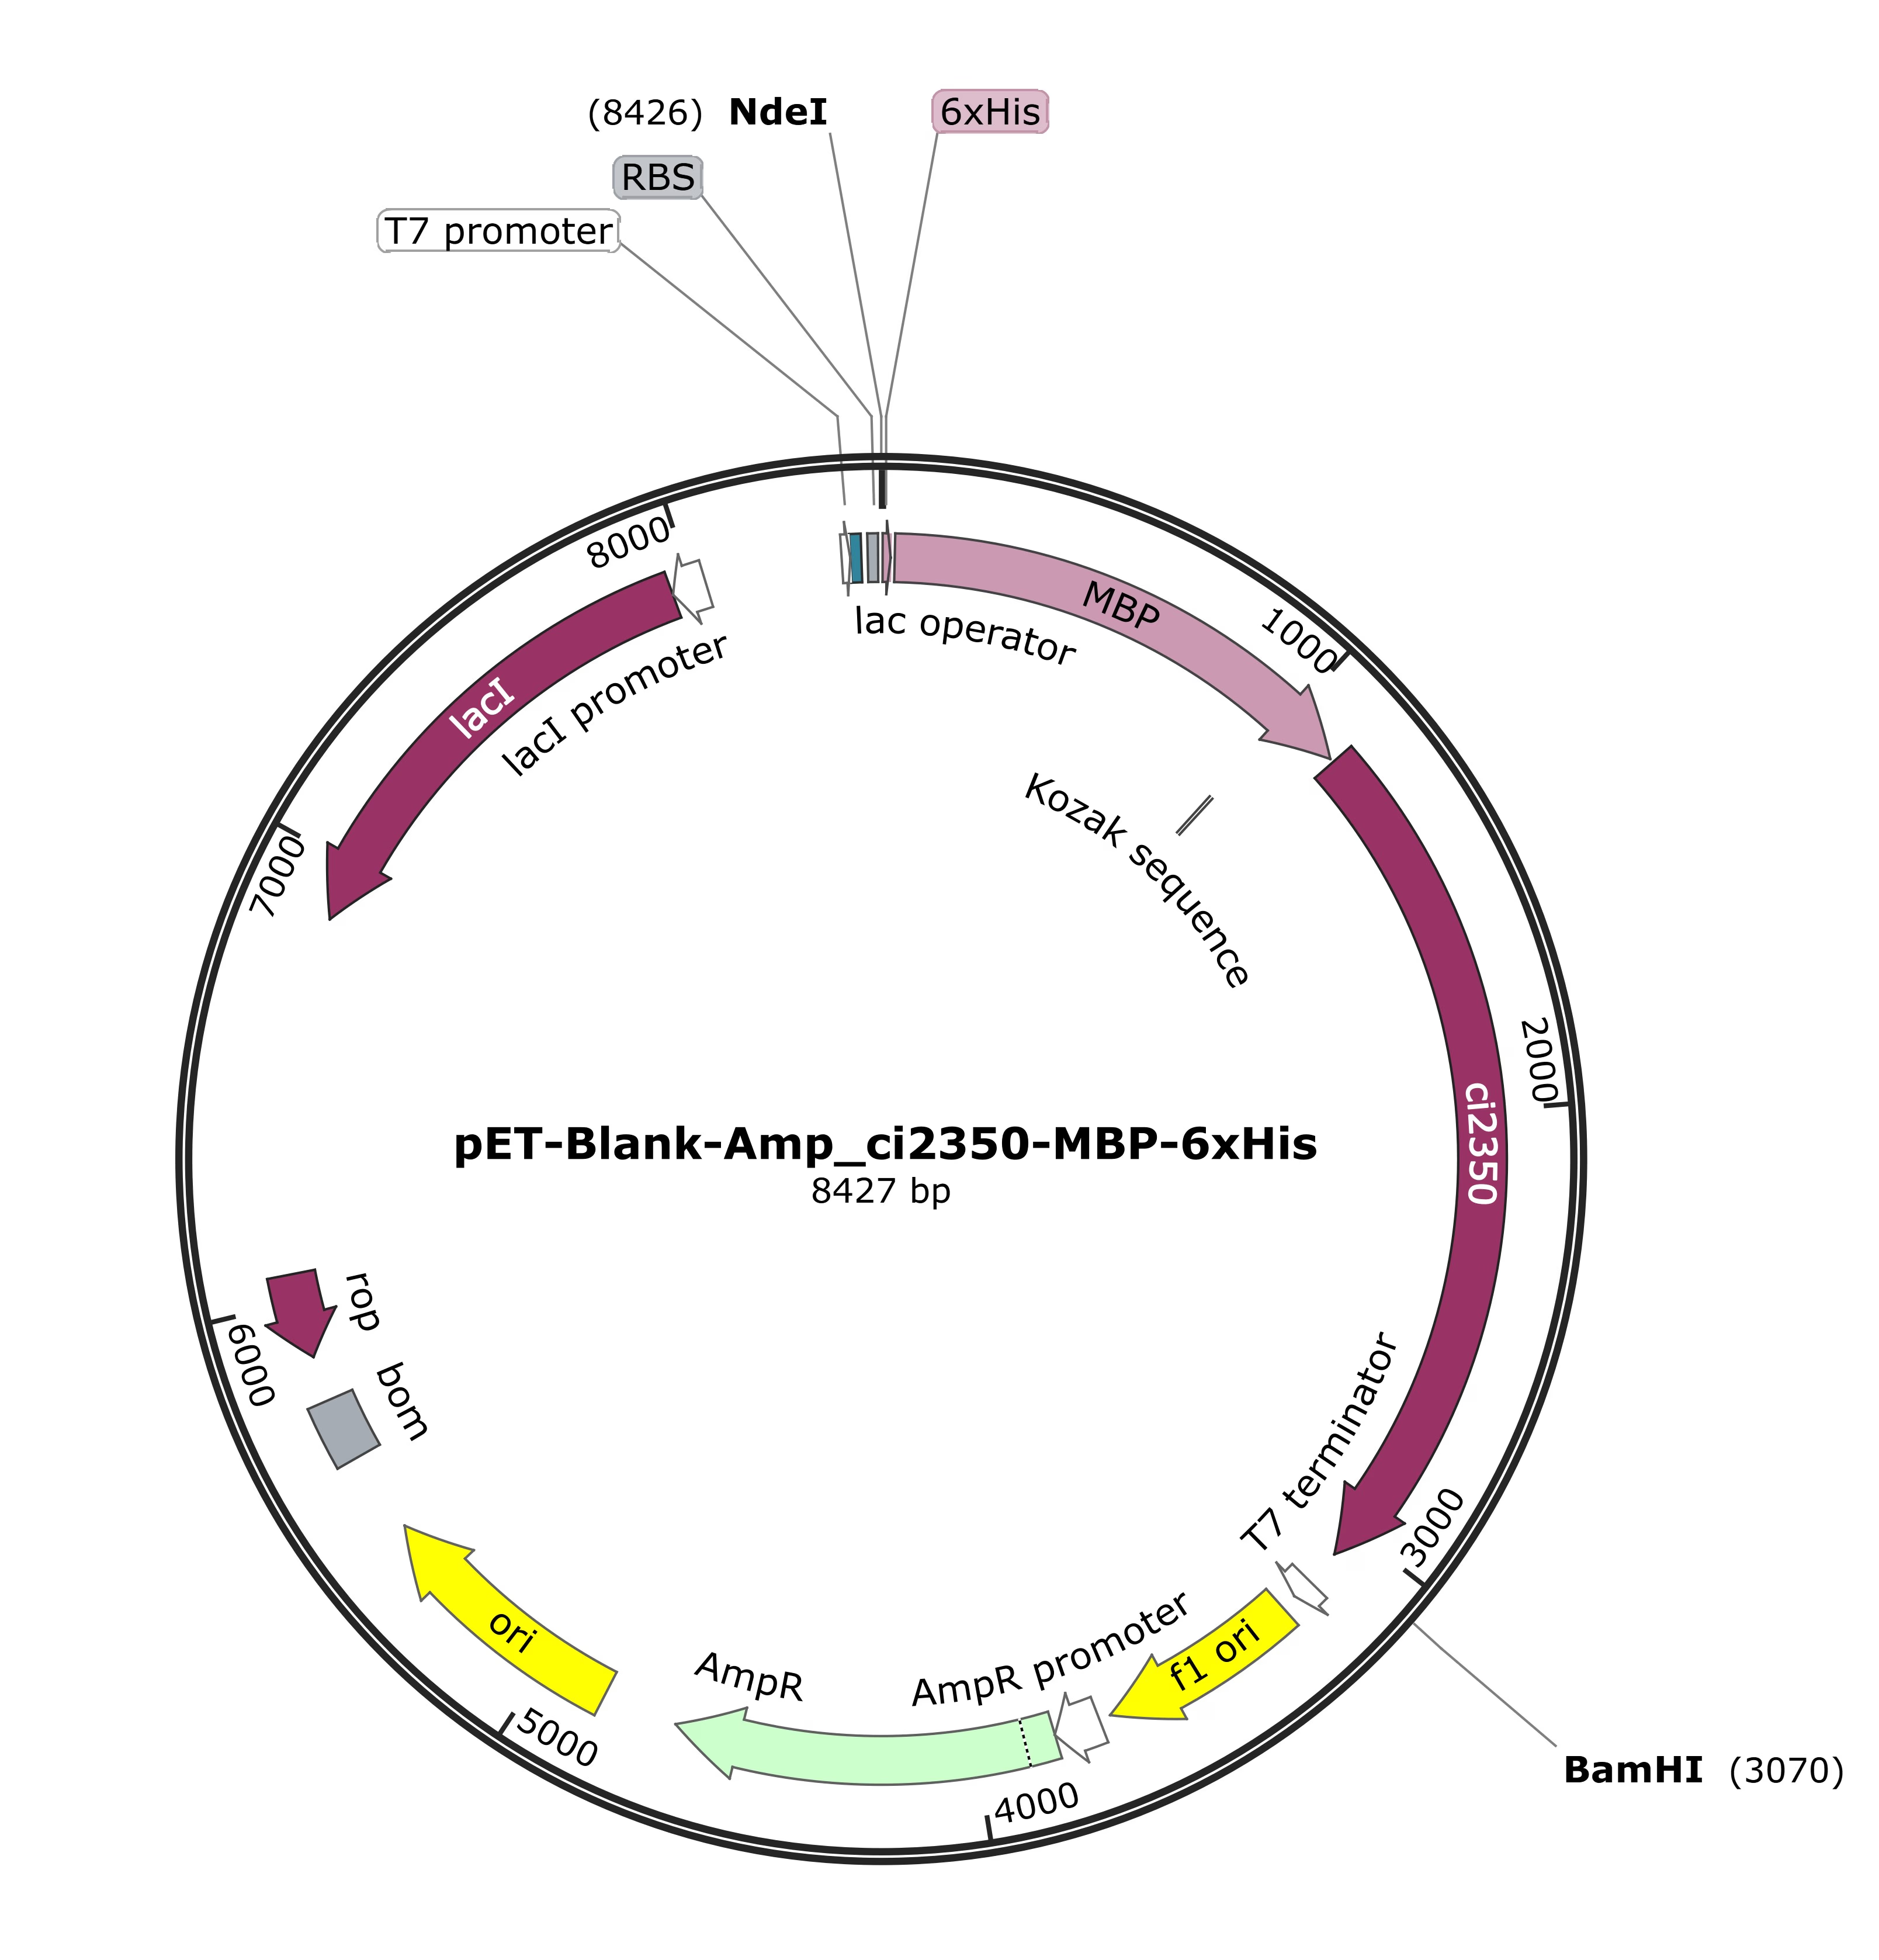
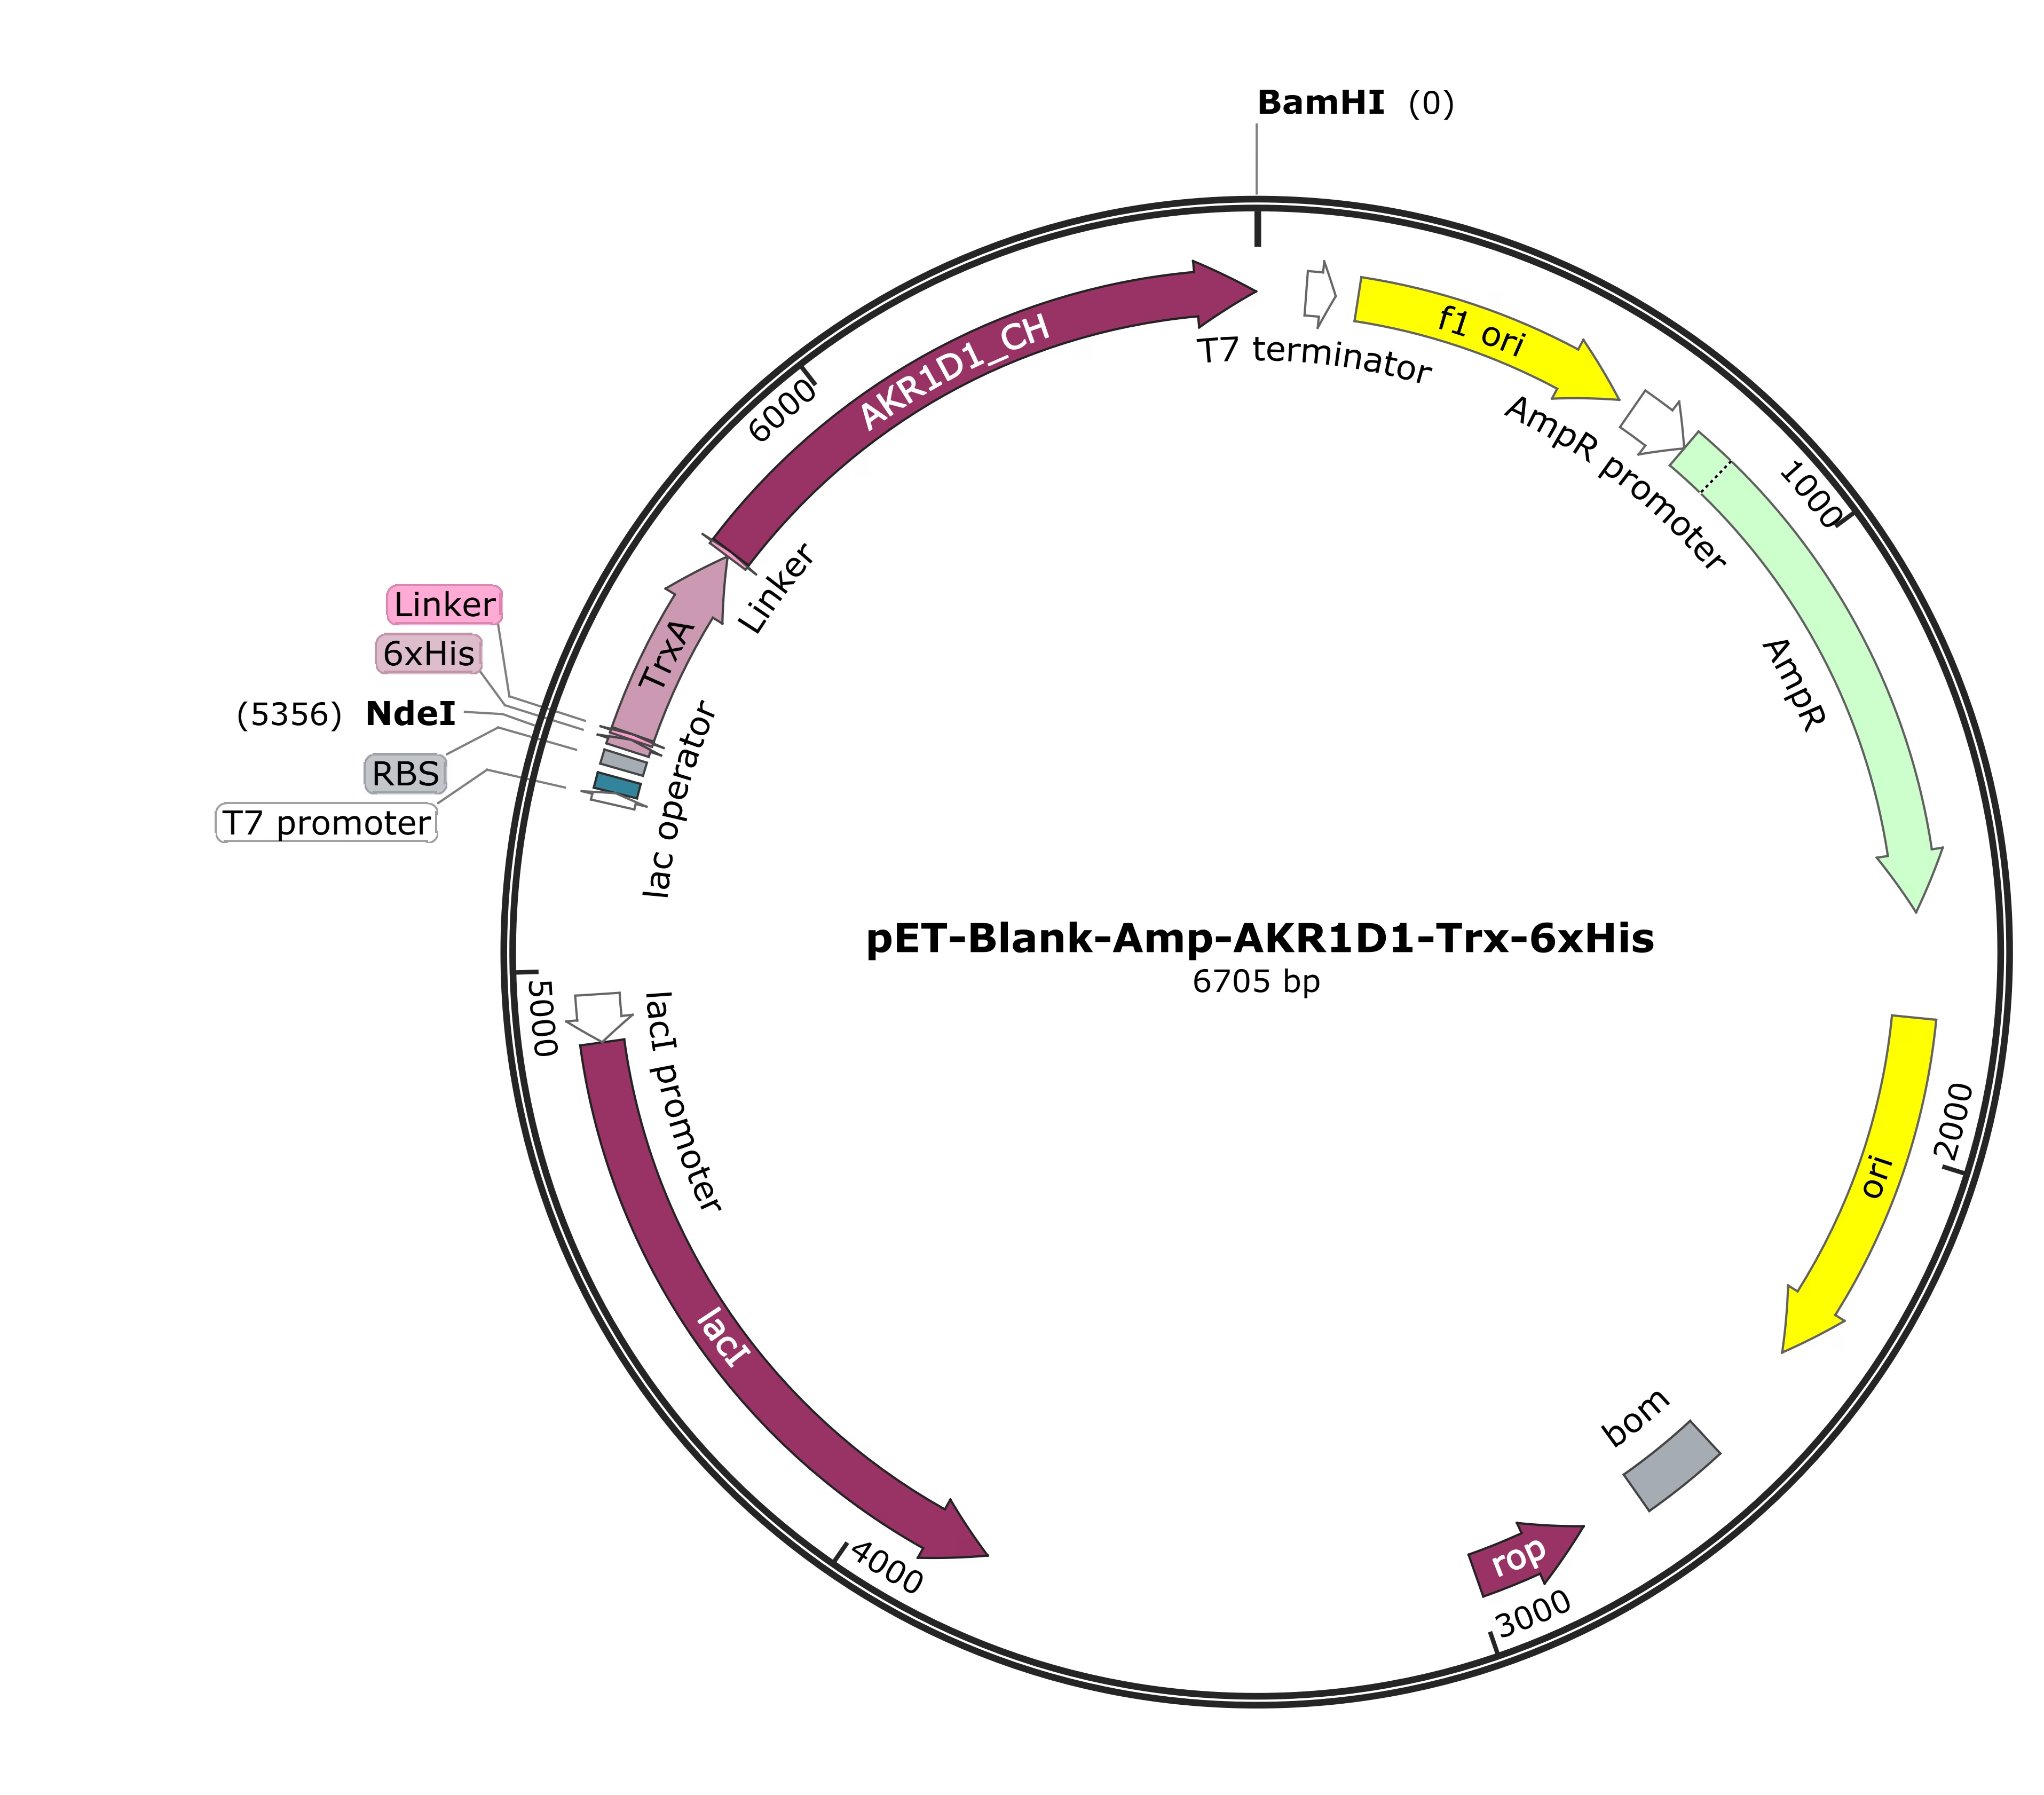
Because the ci2350-MBP-6xHis (BBa_26P2621O) exceeded the size limit for IDT gBlocks, it was ordered as a clonal gene from Twist Bioscience, directly cloned into their pET-Blank-Amp expression vector (with T7 promoter).
Note: in the text, the -6xHis part is sometimes omitted as shorthand, e.g. ci2350-MBP means ci2350-MBP-6xHis
The parts were originally intended for insertion into the pET-11aA plasmid commonly used to produce proteins in E. coli. vector. Despite multiple rounds of restriction digestion (BamHI, NdeI), ligation, transformation, and troubleshooting (detailed in Notebook Summaries, Weeks 25, 26, 27), ci2350-6xHis was the first constructs successfully cloned into pET-11a and transformed into E. coli TG1, as confirmed by colony PCRA quick check of bacterial colonies for the right insert: a PCR run directly on a small sample of each colony. (Figure 25). The results from Eurofins sequencing confirmed that the construct contained no mutations.
After several more cycles of trying and failing, pET-11a-AKR1D1-6xHis became the second and last construct to be successfully created and transformed into E. coli TG1 on Week 30, confirmed by colony PCR (Figure 26) and sequencing results.
After multiple unsuccessful attempts at restriction digestion, along with the difficulty of verifying that pET-11a was actually cut with both NdeI and BamHI (due to the cutout being very small), we decided to approach restriction digestion from a different angle. We already had a ready-made plasmid vector pET-Blank-Amp-ci2350-MBP-6xHis, synthesized by Twist Bioscience, with NdeI and BamHI sites flanking the insert. Double digestionCutting DNA with two restriction enzymes at once. of this plasmid released a 3081 bp ci2350-MBP-6xHis fragment, significantly larger than the 40 bp pET-11a fragment, making it easy to distinguish single from double-digested plasmid on agarose gels and enabling clean gel extraction of the linearized vector backbone, pET-Blank-Amp (Figure 27).
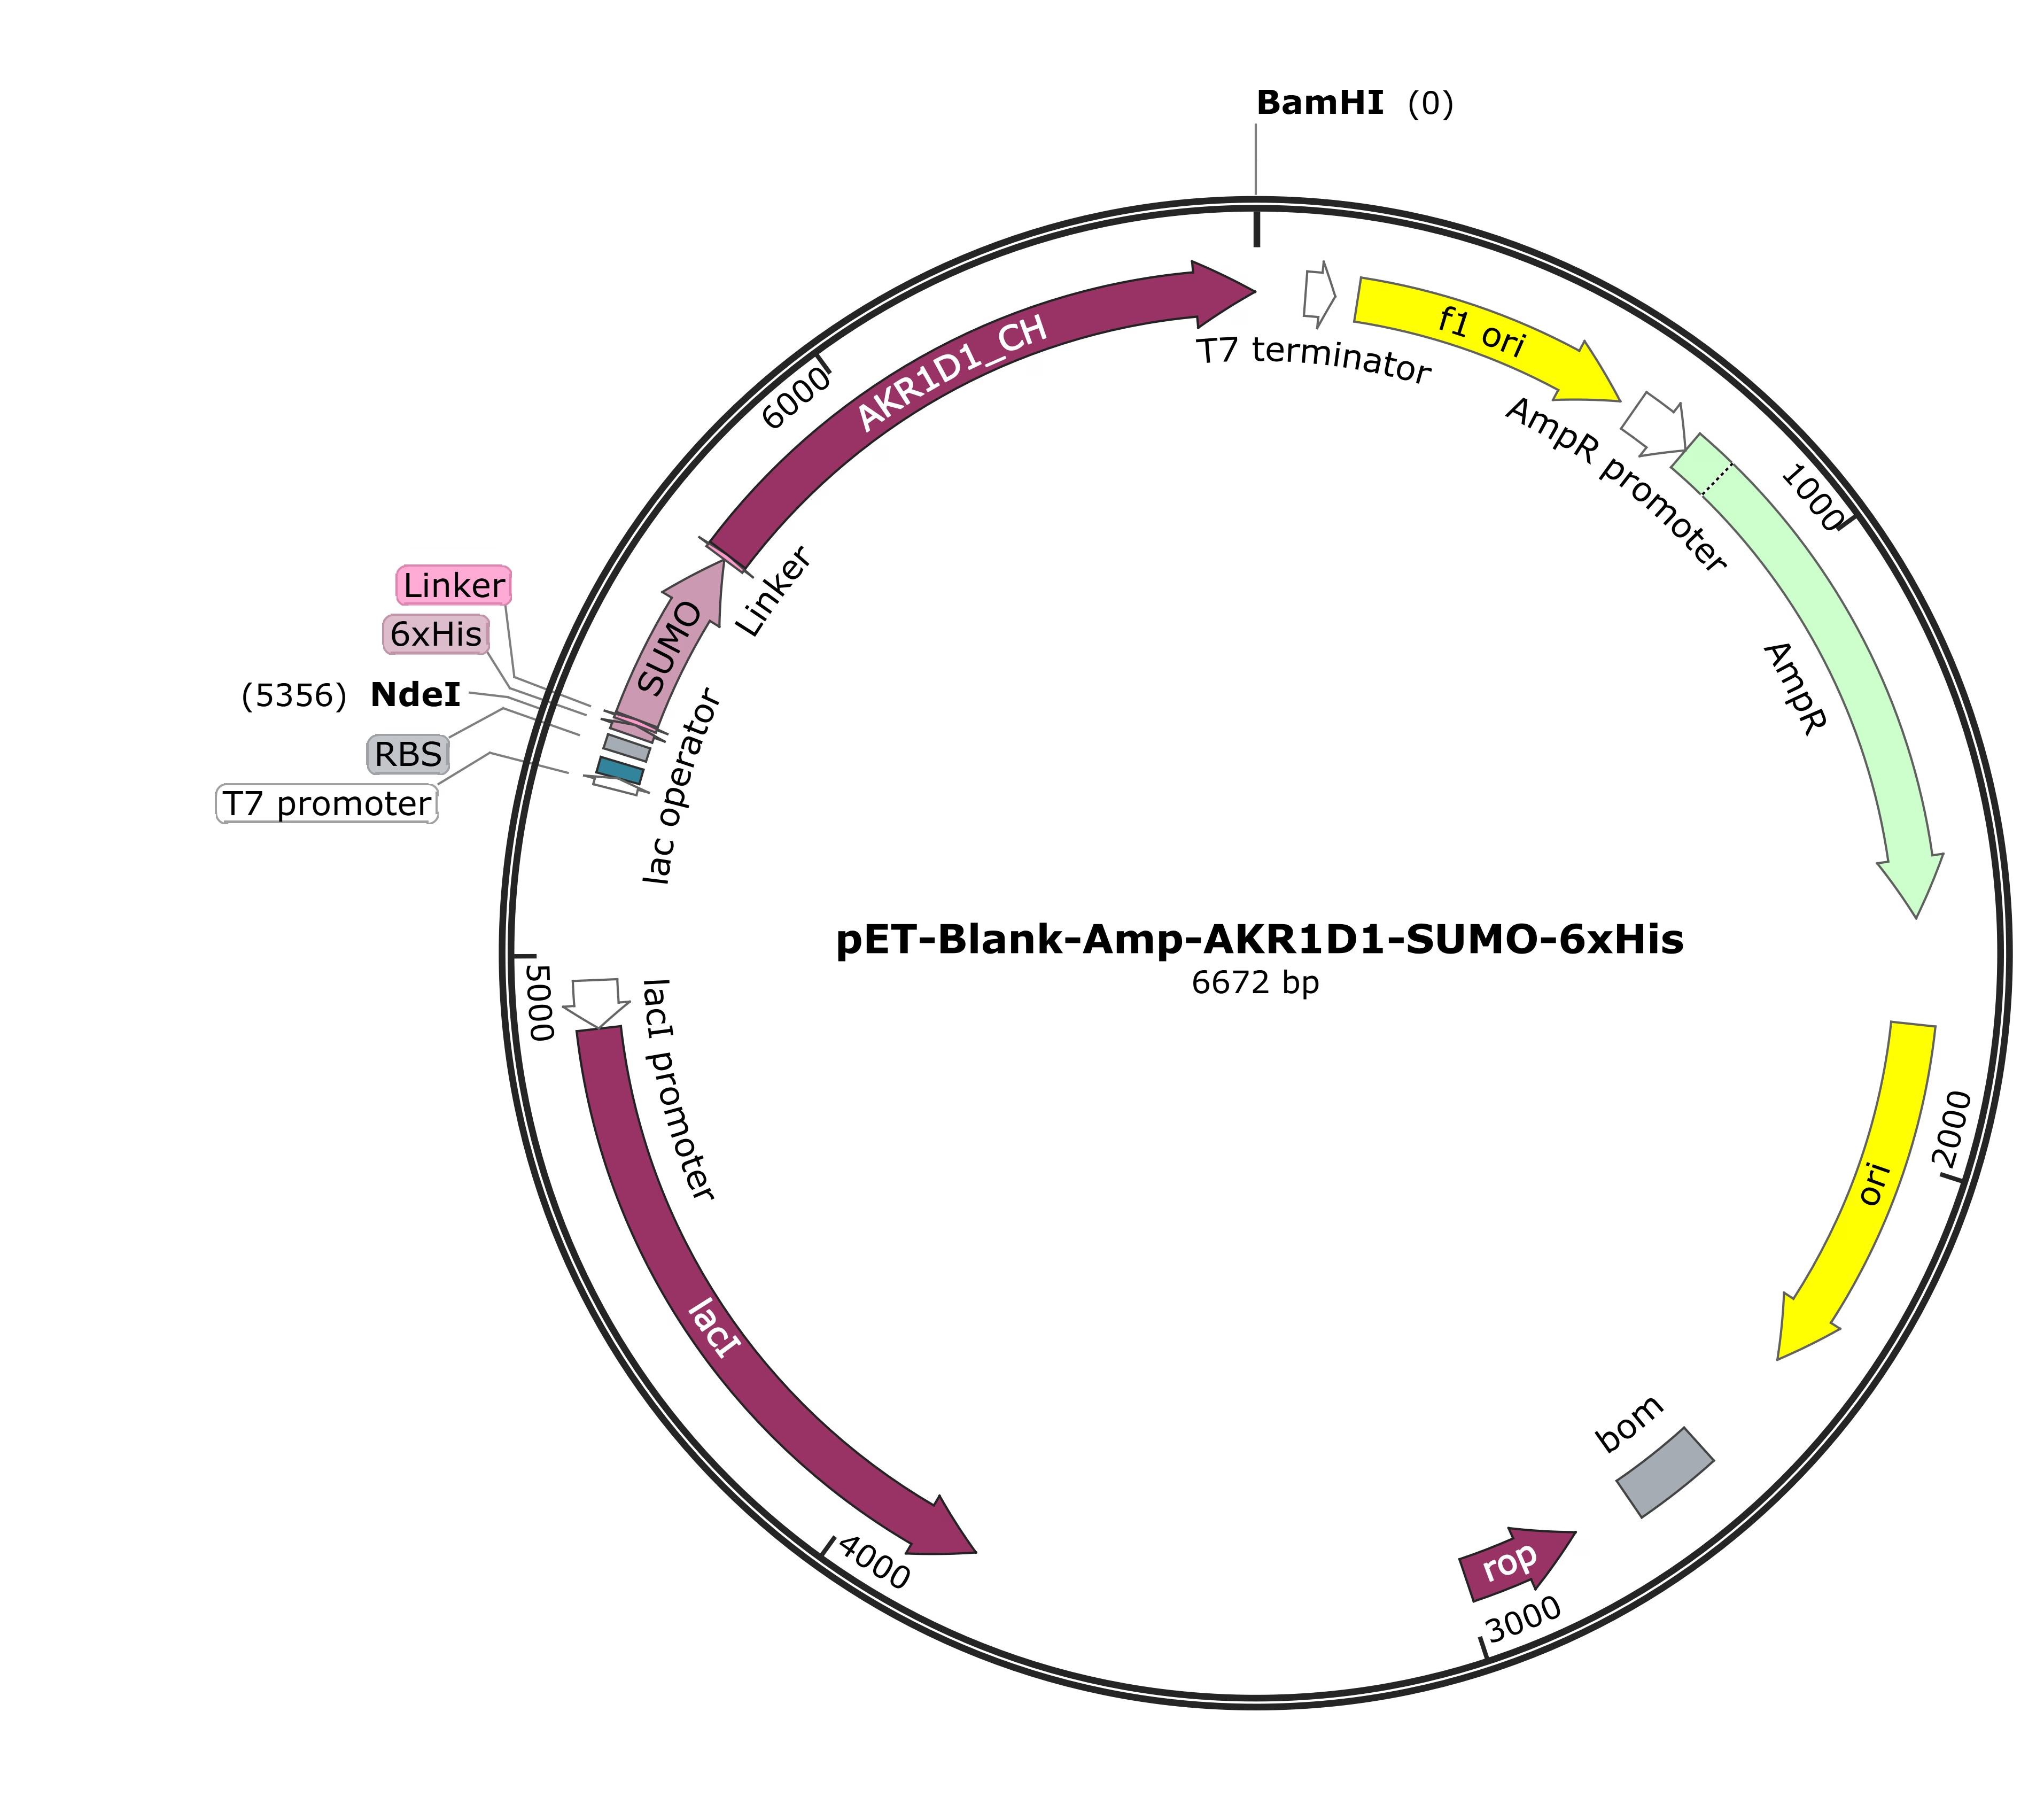
We tested this method and adopted it for further cloning, as it proved more reliable than direct pET-11a digestion, allowing us to successfully clone AKR1D1-SUMO-6xHis and AKR1D1-TrxA-6xHis into pET-Blank-Amp by Week 31, as indicated by colony PCR (Figure 28) and subsequent sequencing.
However, we still failed to clone ci2350-SUMO-6xHis, ci2350-TrxA-6xHis, AKR1D1-MBP-6xHis into pET-Blank-Amp. Due to time constraints, we decided to proceed with protein expression using the successfully cloned constructs.
AKR1D1: Fusion Tag and Induction Strength
Although the enzyme specificity engineering analysis showed AKR1D1 could not be engineered for selectivity at the positions tested, expression optimization was still carried out in parallel to identify the tag configuration that yielded the most soluble protein, and to benchmark these conditions for any future engineering approach targeting different positions.
TrxA gave the most soluble AKR1D1, and a lower IPTG concentration gave a higher soluble fraction.
AKR1D1-6xHis (~38 kDaKilodalton, a unit of protein size. 1 kDa is 1,000 daltons., pET-11a), AKR1D1-SUMO (~49 kDa) and AKR1D1-TrxA (~50 kDa, both pET-Blank) were expressed in E. coli BL21(DE3) at 37 °C for 3 h with 1 mM IPTG. Each construct had three induced cultures, plus uninduced and empty-vector controlsControls with the plasmid but without the gene, showing what the host cells do on their own.. Whole-cell samples were adjusted to OD 20 and loaded equally. Solubility is the soluble band volume divided by the total band volume. The target band was visible in all induced cultures, mostly in the whole-cell fraction (Notebooks and Protocols › Figure 32, Notebooks and Protocols › Figure 33 and Notebooks and Protocols › Figure 34). Solubility was 17 ± 4% for His, 10 ± 5% for SUMO, and 26 ± 1% for TrxA (see Table 5 and Notebooks and Protocols › Figure 36). SUMO gave the lowest value, although its range overlaps with 6xHis. The uninduced controls gave impossible values (42% to 245%) and were excluded.
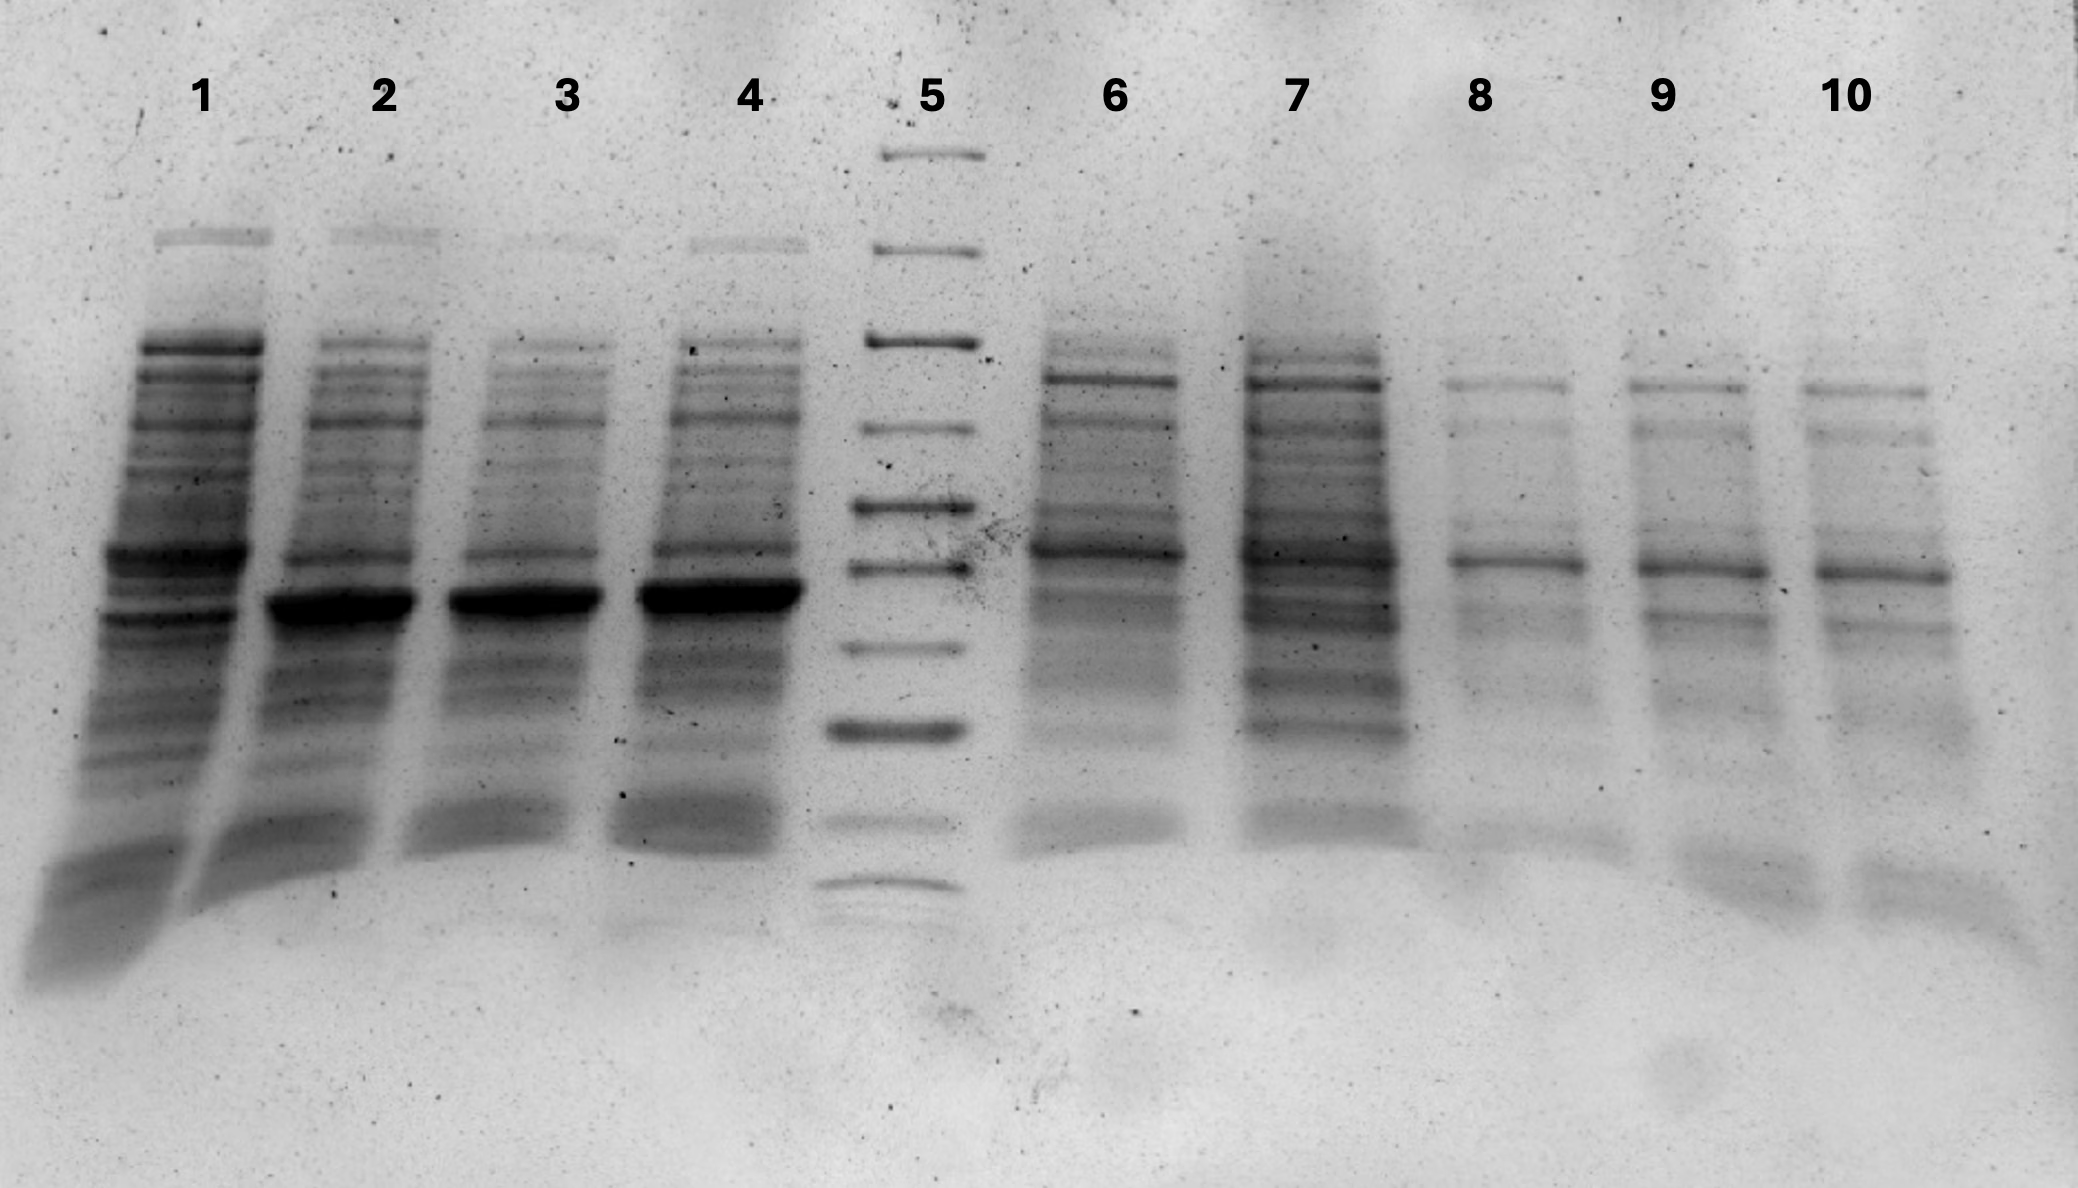
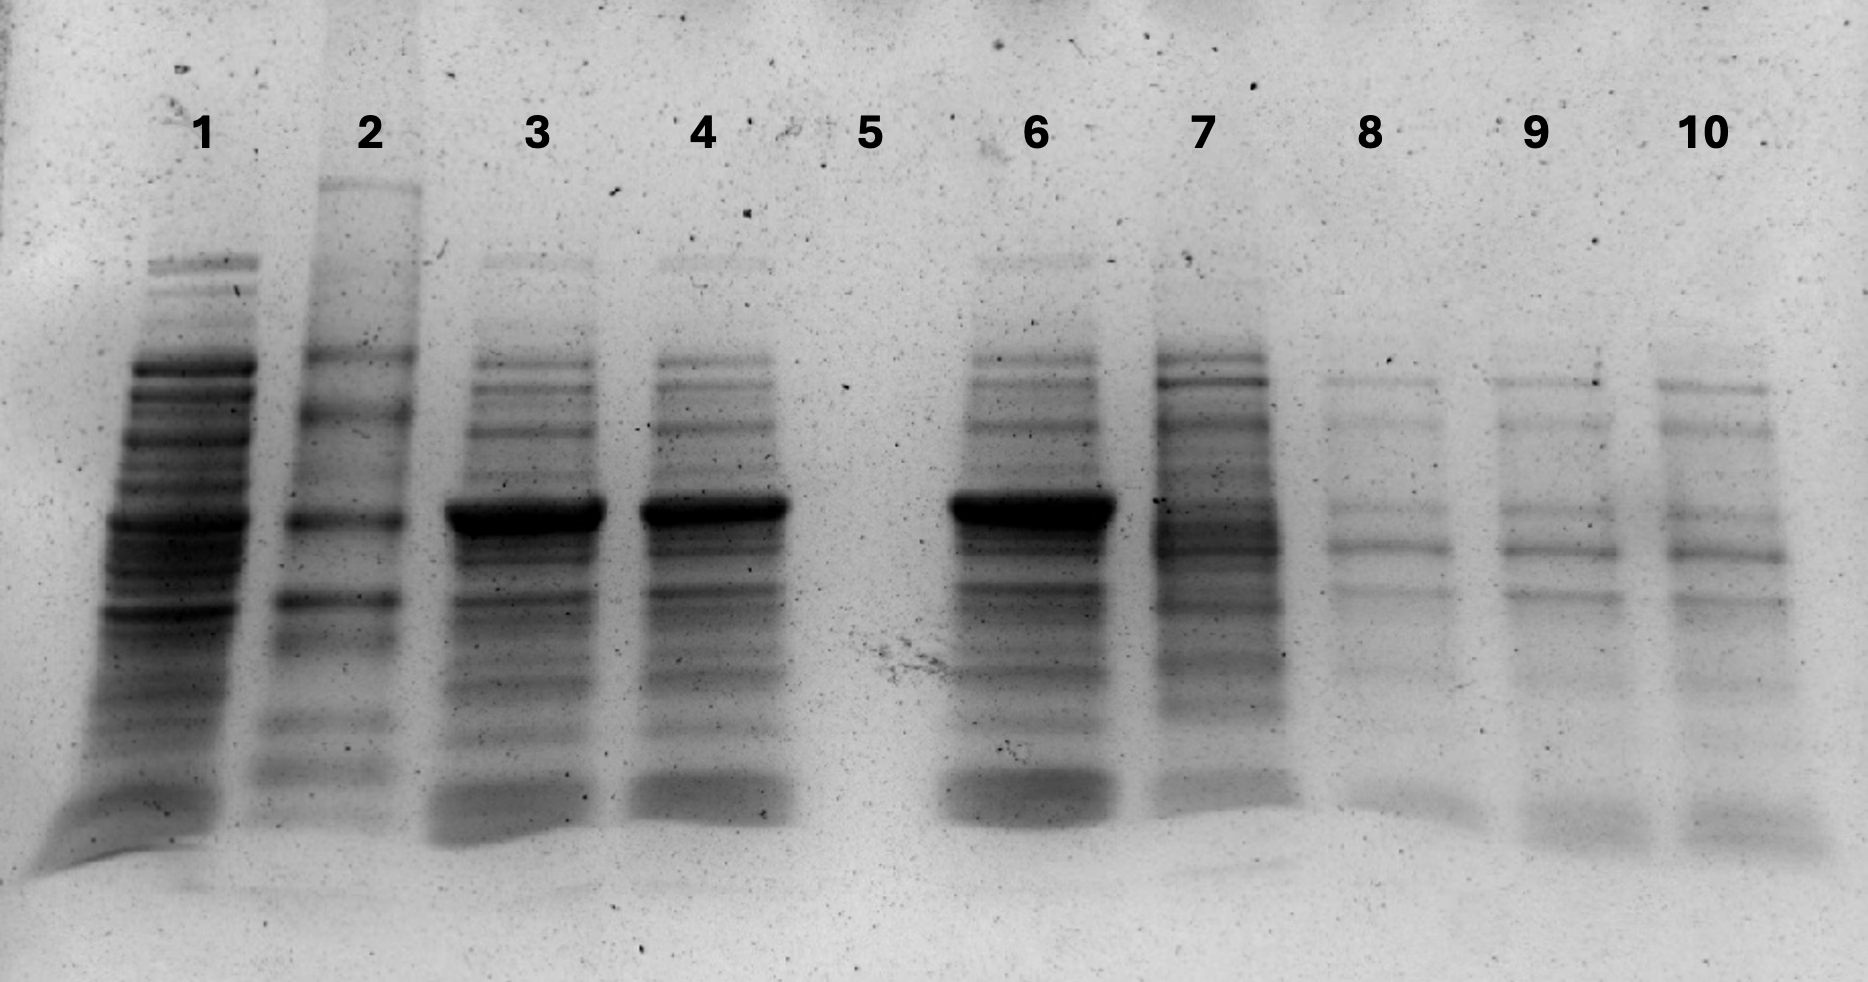
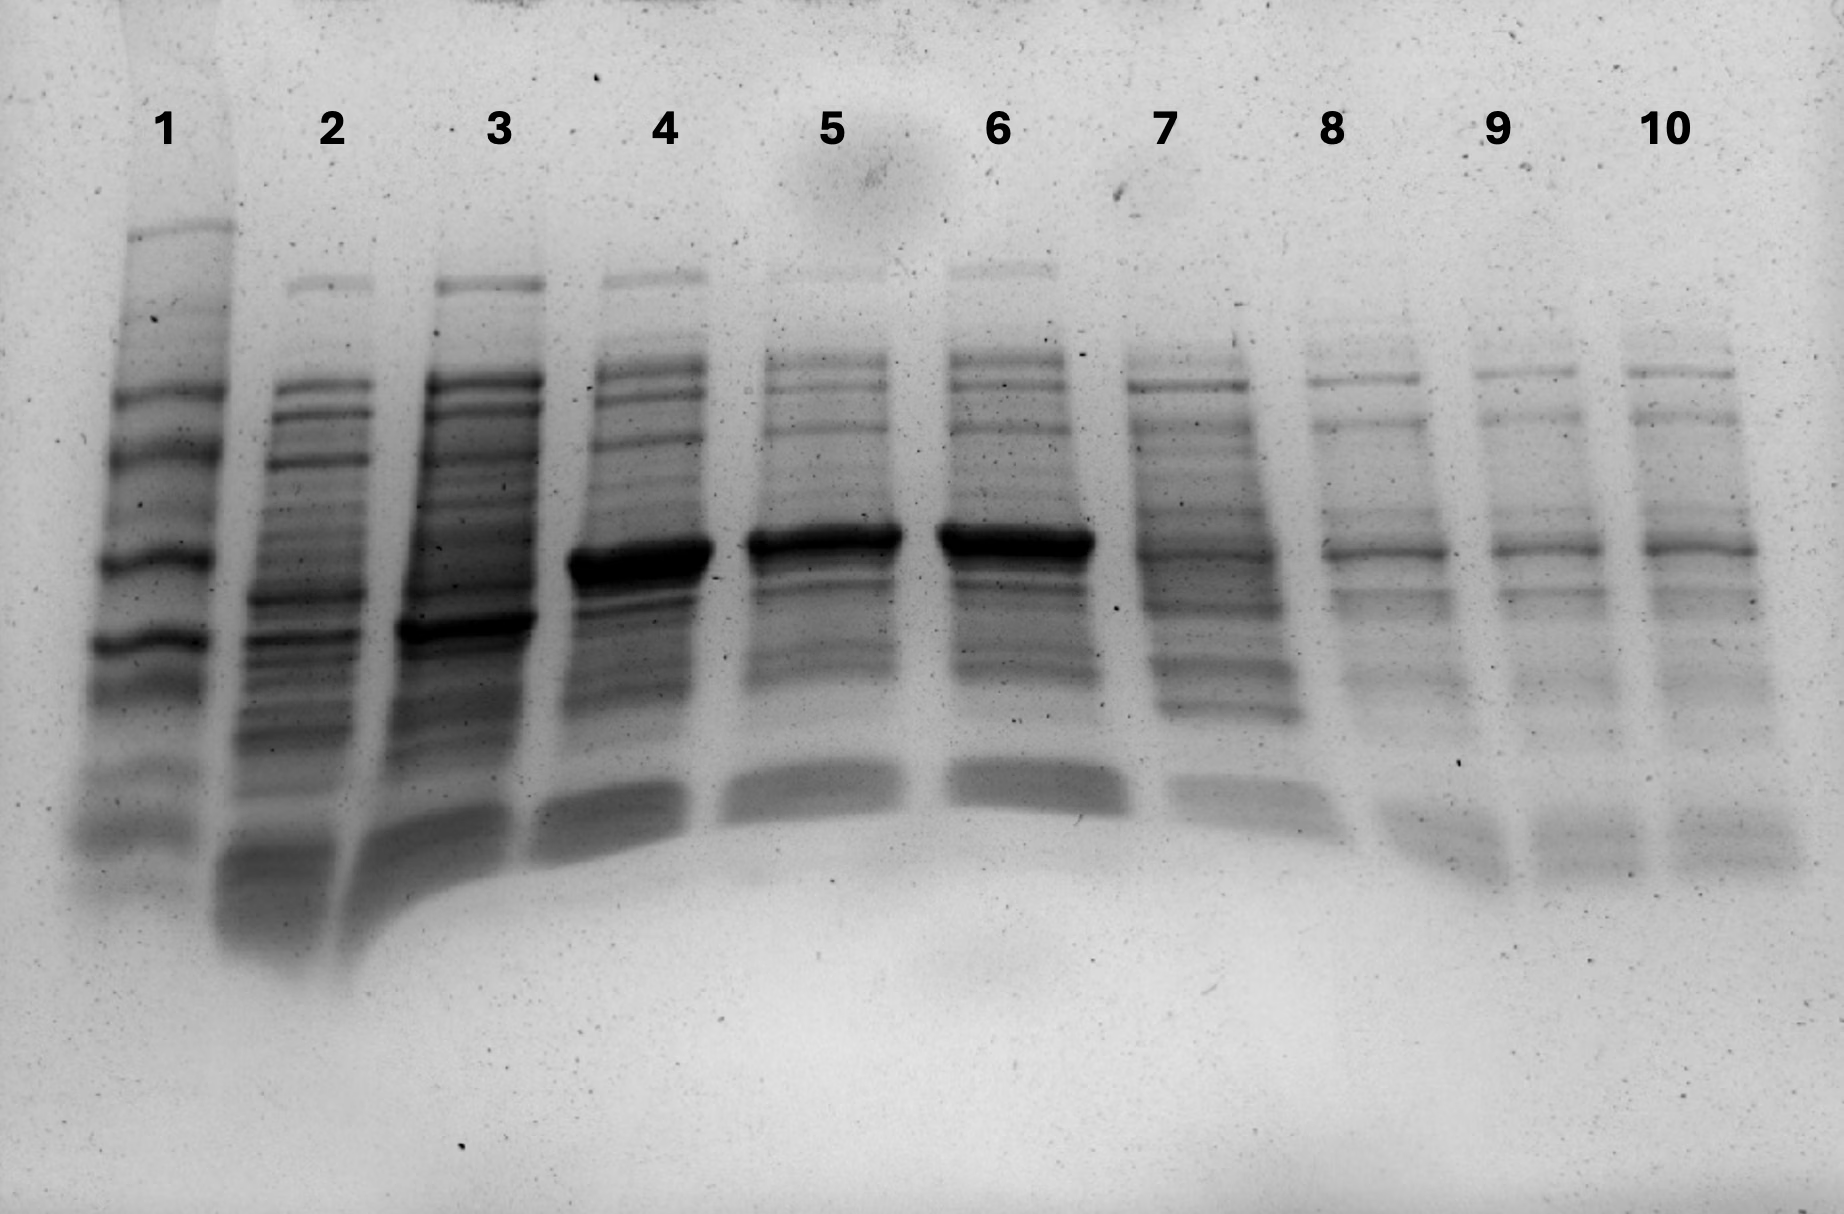
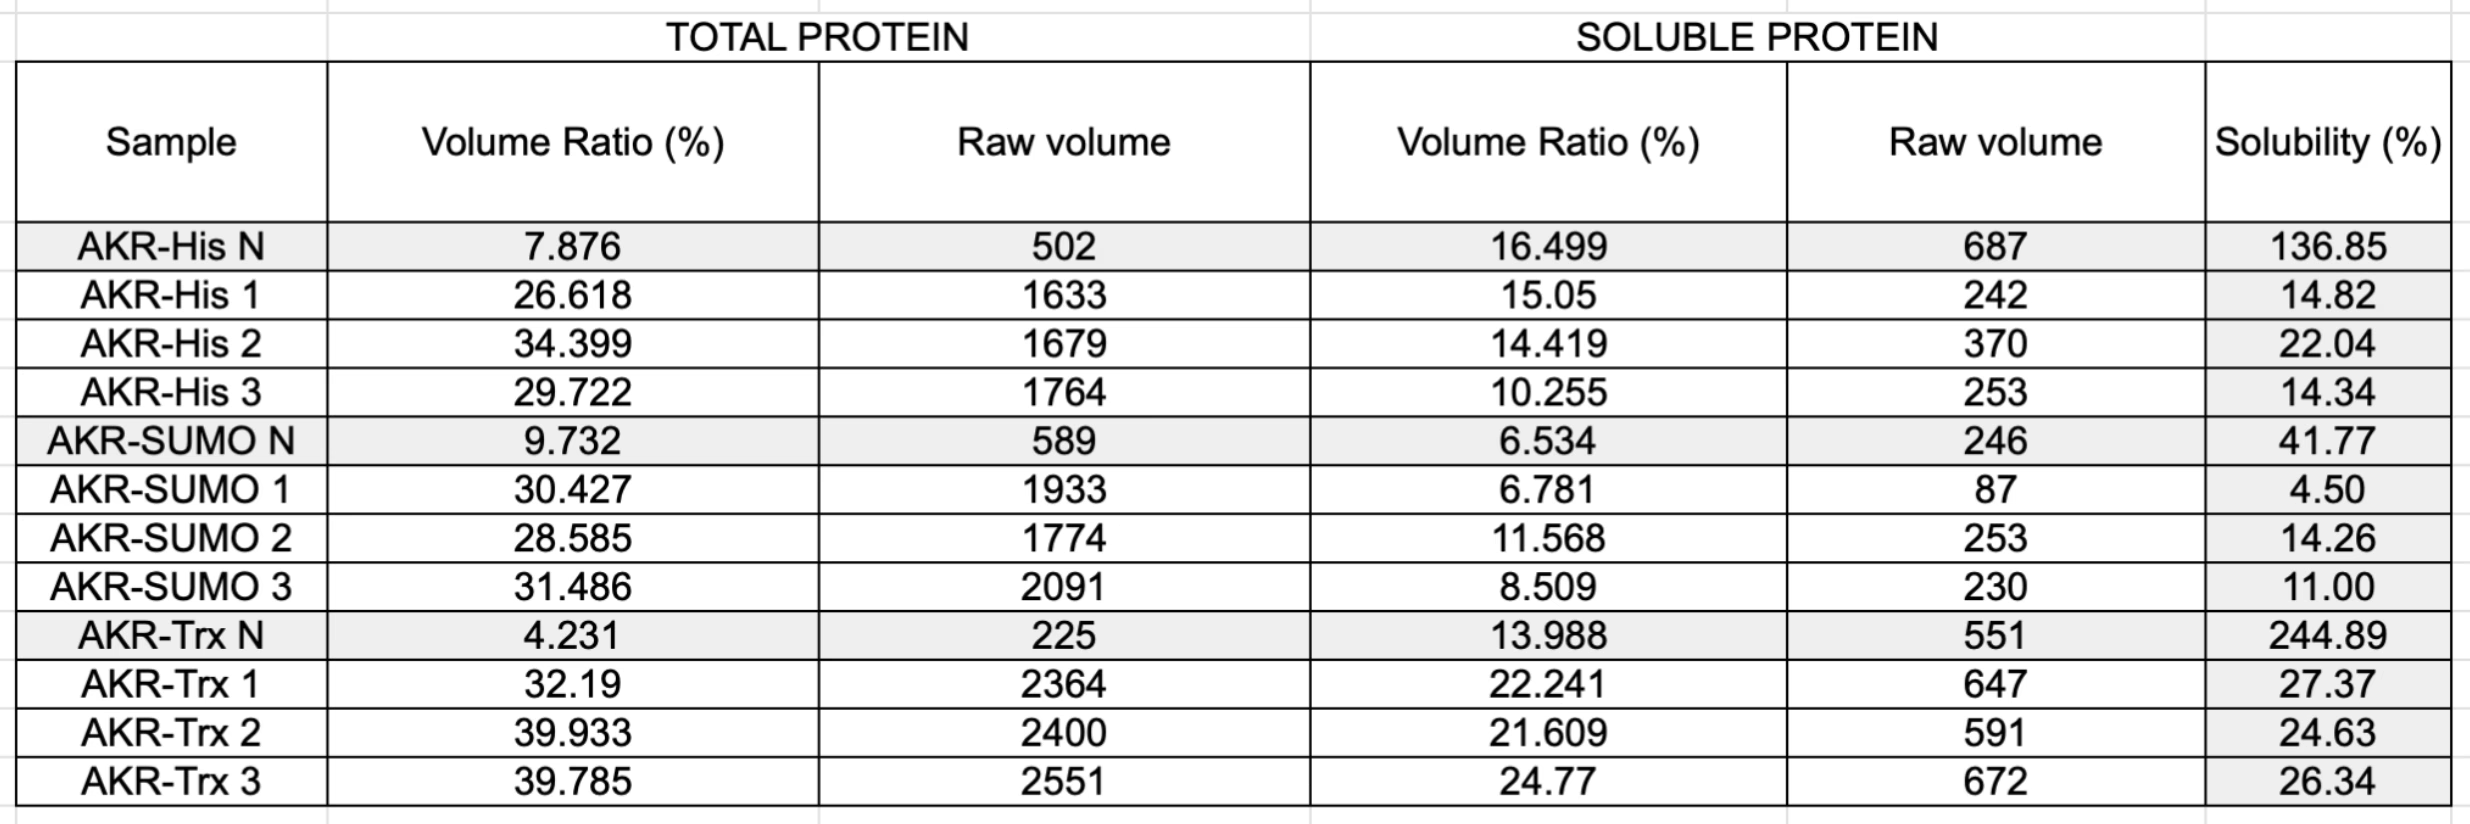
| Construct | Replicate 1 (%) | Replicate 2 (%) | Replicate 3 (%) | Mean ± SD |
|---|---|---|---|---|
| AKR1D1-6xHis | 14.8 | 22.0 | 14.3 | 17.1 ± 4.3 |
| AKR1D1-SUMO | 4.5 | 14.3 | 11.0 | 9.9 ± 5.0 |
| AKR1D1-TrxA | 27.4 | 24.6 | 26.3 | 26.0 ± 1.4 |
Lowering the IPTG concentration increased the soluble fraction of AKR1D1-TrxA. Three cultures per concentration were induced at 37 °C for 3 h and lysed with B-PERA reagent that breaks open bacterial cells to release their proteins.. Solubility was 37 ± 4% at 0.2 mM and 28 ± 4% at 0.4 mM (Table 6 and Notebooks and Protocols › Figure 37). The earlier 1 mM experiment gave 26%, so most of the gain came at 0.2 mM. Each value comes from three cultures (n = 3) in one experiment and the gels differ, so these values are only indicative.
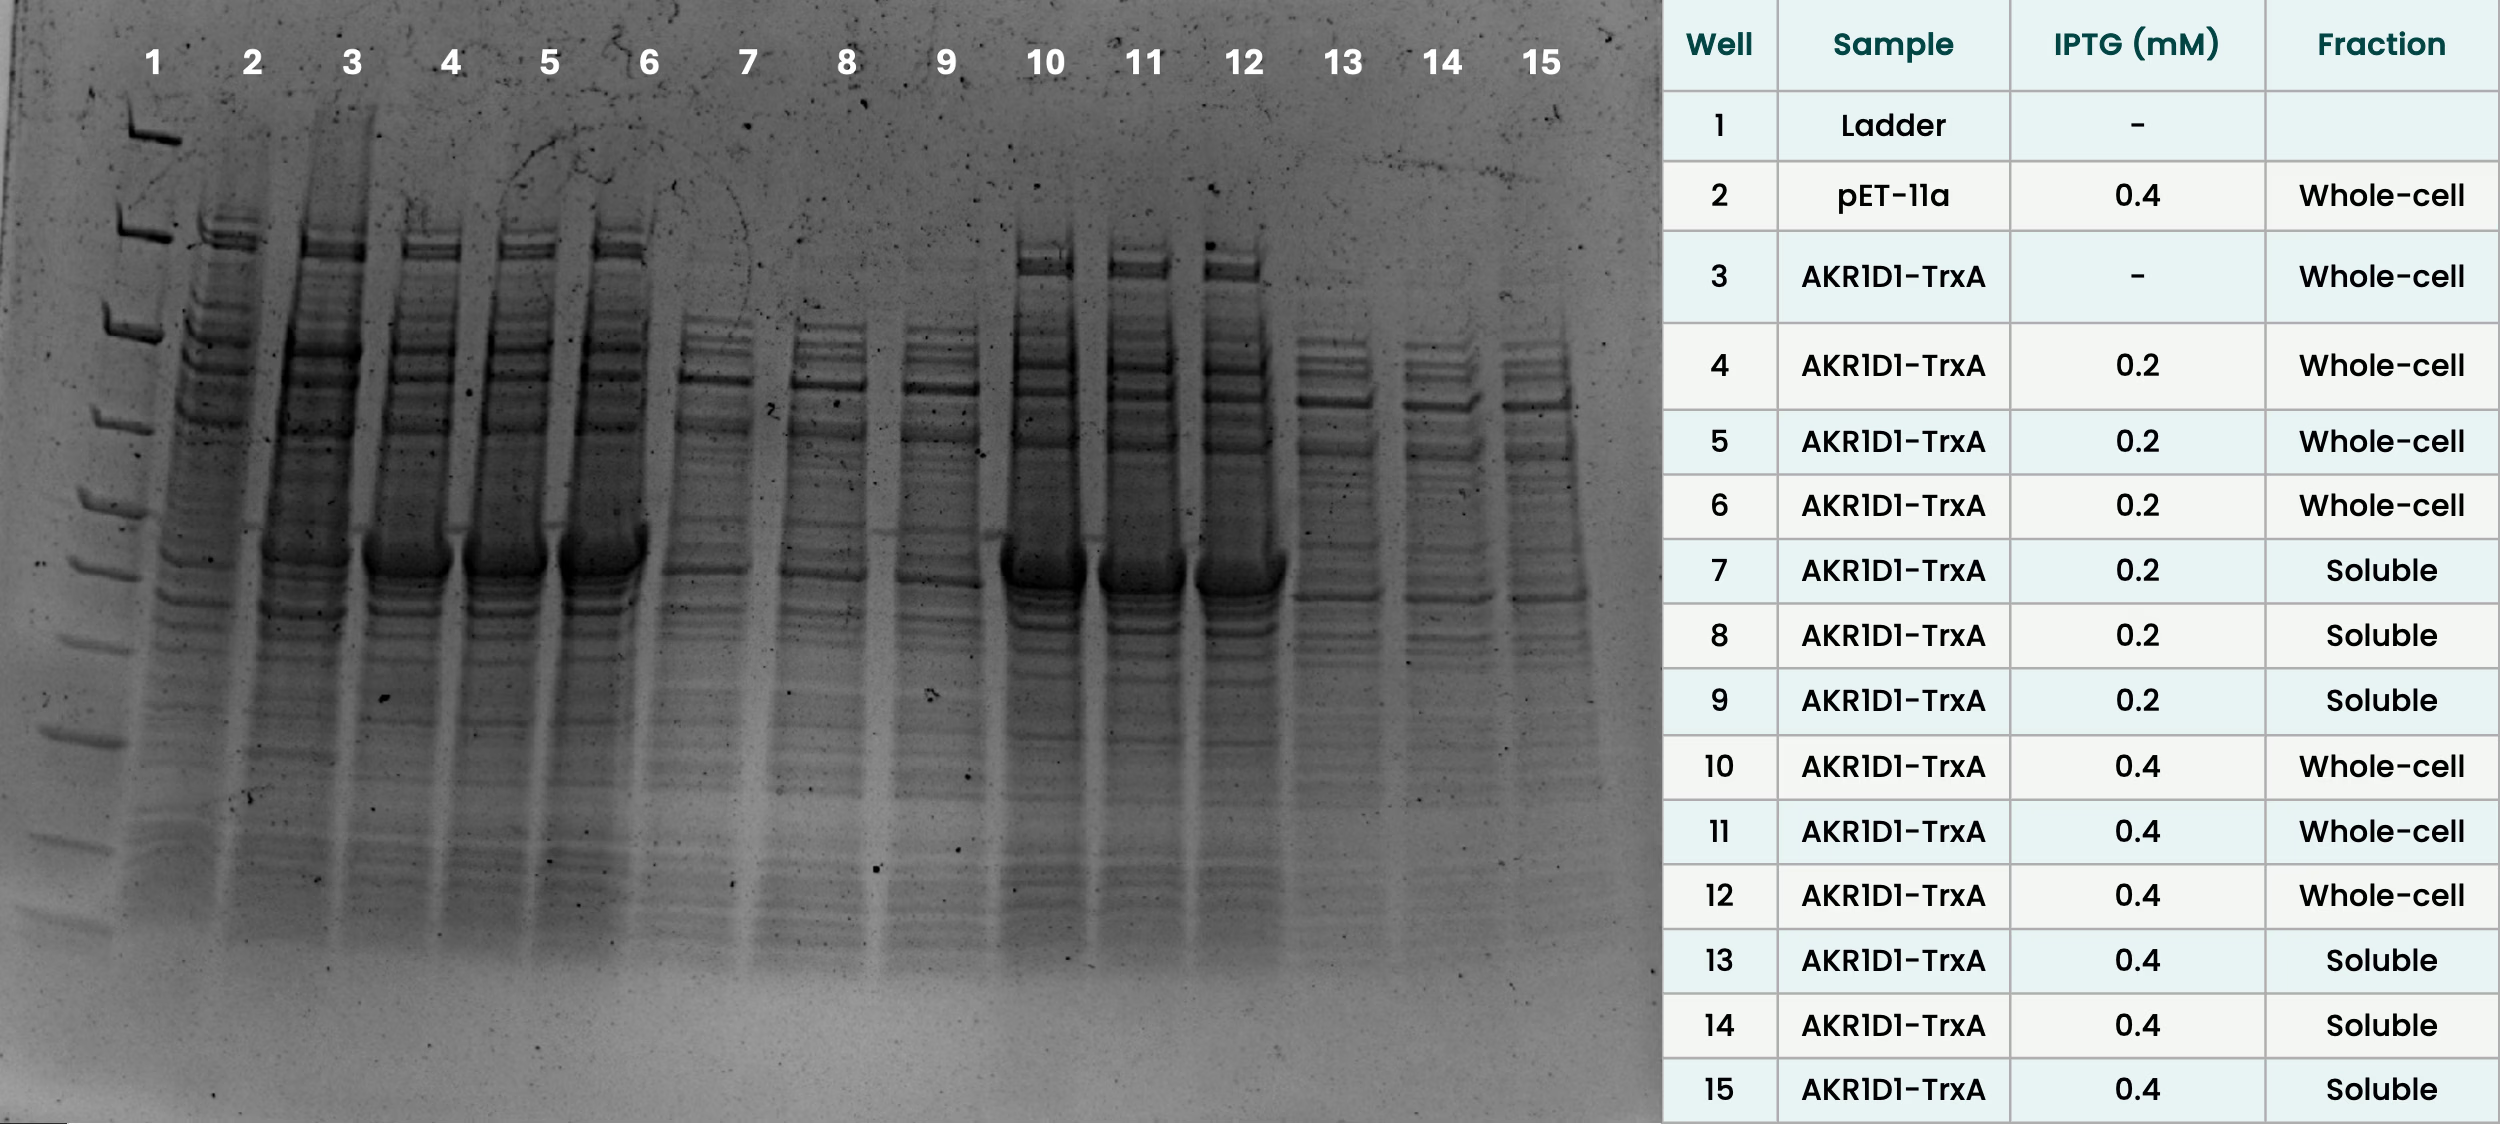
| IPTG (mM) | Replicates (%) | Mean ± SD (%) |
|---|---|---|
| 0.2 | 41.6, 37.4, 33.3 | 37.4 ± 4.1 |
| 0.4 | 24.5, 32.9, 27.5 | 28.3 ± 4.3 |
AKR1D1-TrxA was therefore the most promising construct, but even at 0.2 mM about 60% of the protein stayed insoluble. It was expressed only aerobically and was not purified, so soluble yield and activity were not compared between tags. AKR1D1-MBP was never cloned successfully and was not tested. The tags were compared in two backbones (6xHis in pET-11a, SUMO and TrxA in pET-Blank), which may add to the differences.
AKR1D1 was expressed in all three tag configurations but mostly into the insoluble fraction. TrxA gave the highest soluble yield at 1 mM IPTG (26 ± 1%, against 17 ± 4% for His and 10 ± 5% for SUMO), and lowering IPTG to 0.2 mM raised this further to 37 ± 4%, though about 60% remained insoluble even then. All values come from three cultures per condition in single experiments, and the His estimate may be affected by a host band at ~38 kDa. AKR1D1 was not purified, and no activity measurements were made, so it is not known whether any of the soluble protein retains catalytic function.
ci2350: Expression, Purification and Purity
ci2350 was expressed as an N-terminal fusion (6xHis, MBP, ci2350; ~112 kDa). ci2350-MBP was expressed and captured by IMACImmobilized metal affinity chromatography: purifying His-tagged proteins by binding them to nickel beads., but every eluateThe liquid that comes off a column after the protein has been released from it. contained other bands, mainly at ~38 and ~70 kDa. Our preparations were therefore not pure. Each SDS-gel was a single experiment without replicates, so the differences are observations and not tested conclusions.
Expression in whole cells
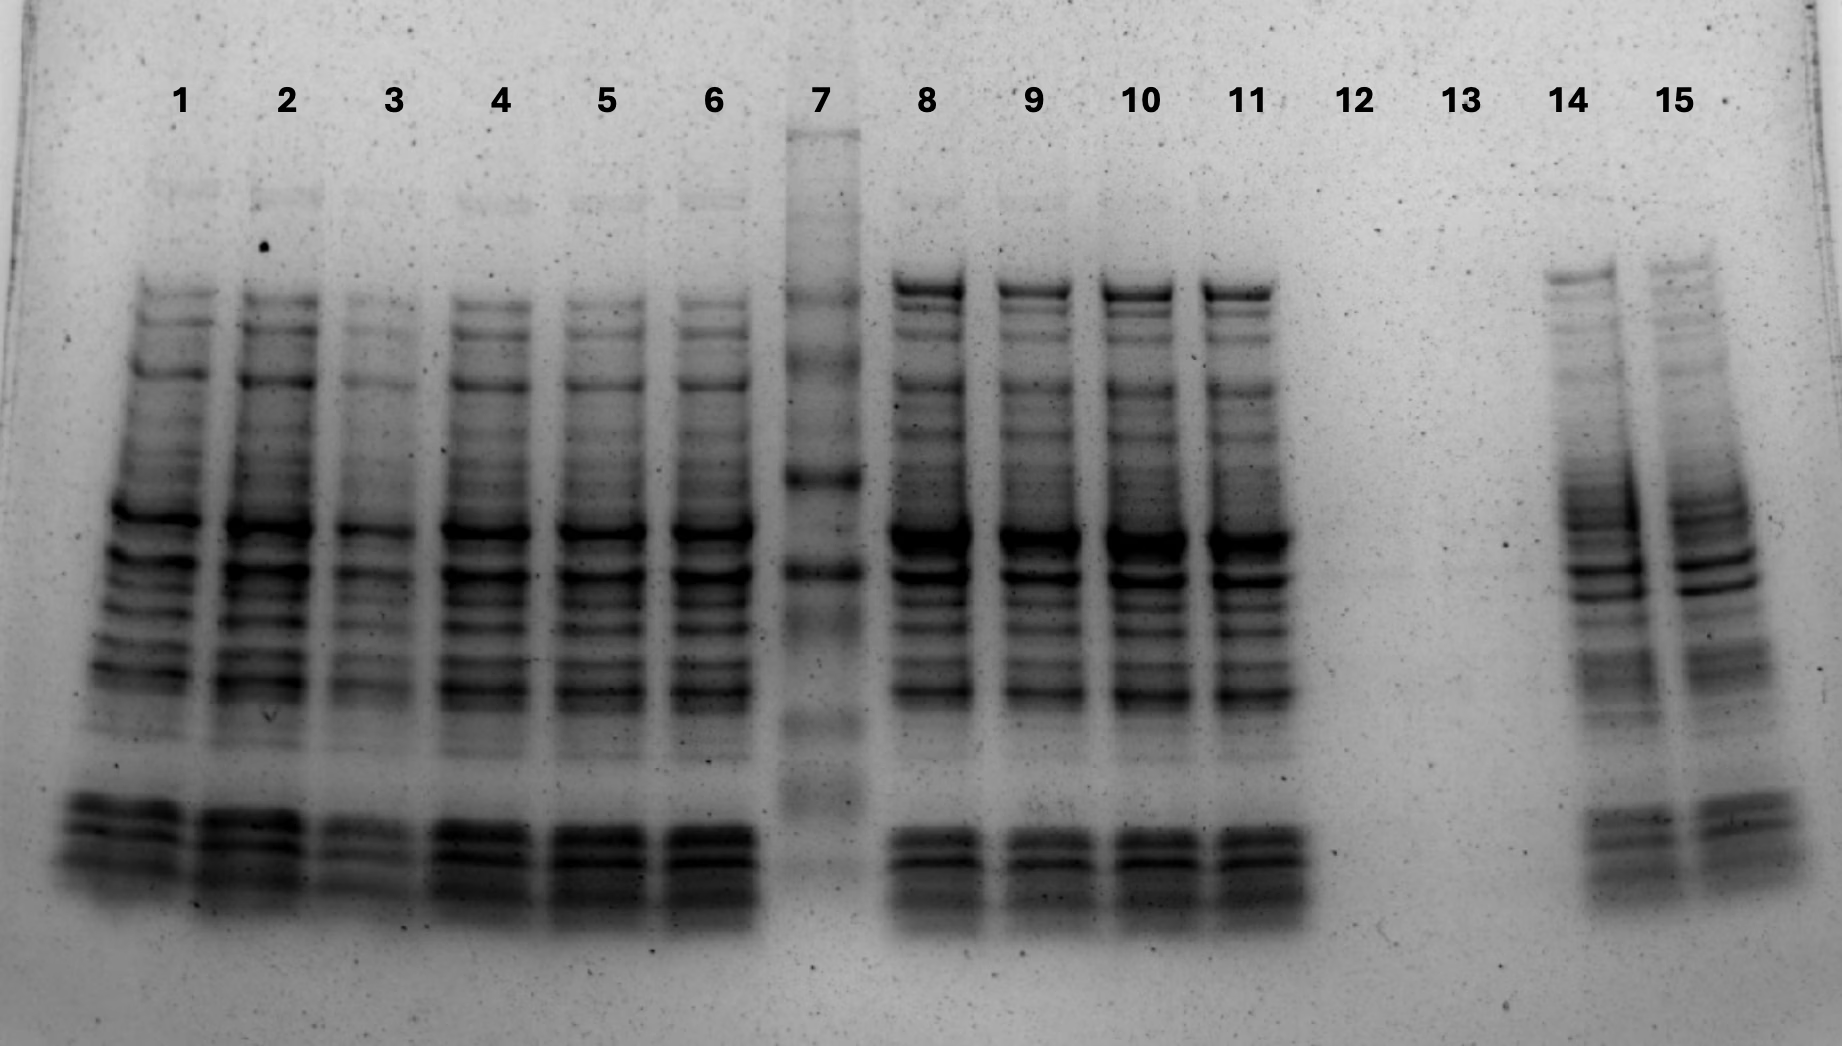
ci2350-6xHis (~70 kDa) showed no visible band at 0, 0.25 or 0.4 mM IPTG, after 3 h or overnight at 37 °C (Notebooks and Protocols › Figure 12). ci2350-MBP showed a band at the expected ~112 kDa in all lanes. It was faint at 0 mM after 3 h and strongest at 0.25 and 0.4 mM after 3 h. A standard curveA line fitted to bands or samples of known size or amount, used to estimate unknown ones. from this gel put the band at ~114 kDa (five lanes, 111.8 to 117.0 kDa; Notebooks and Protocols › Figure 21).
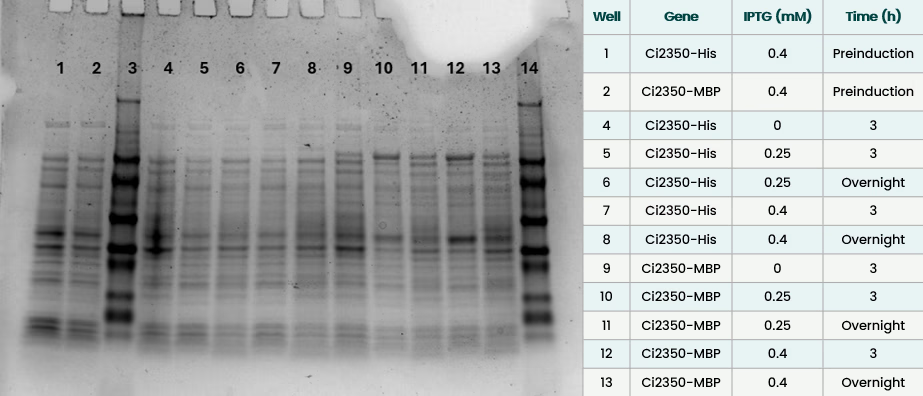
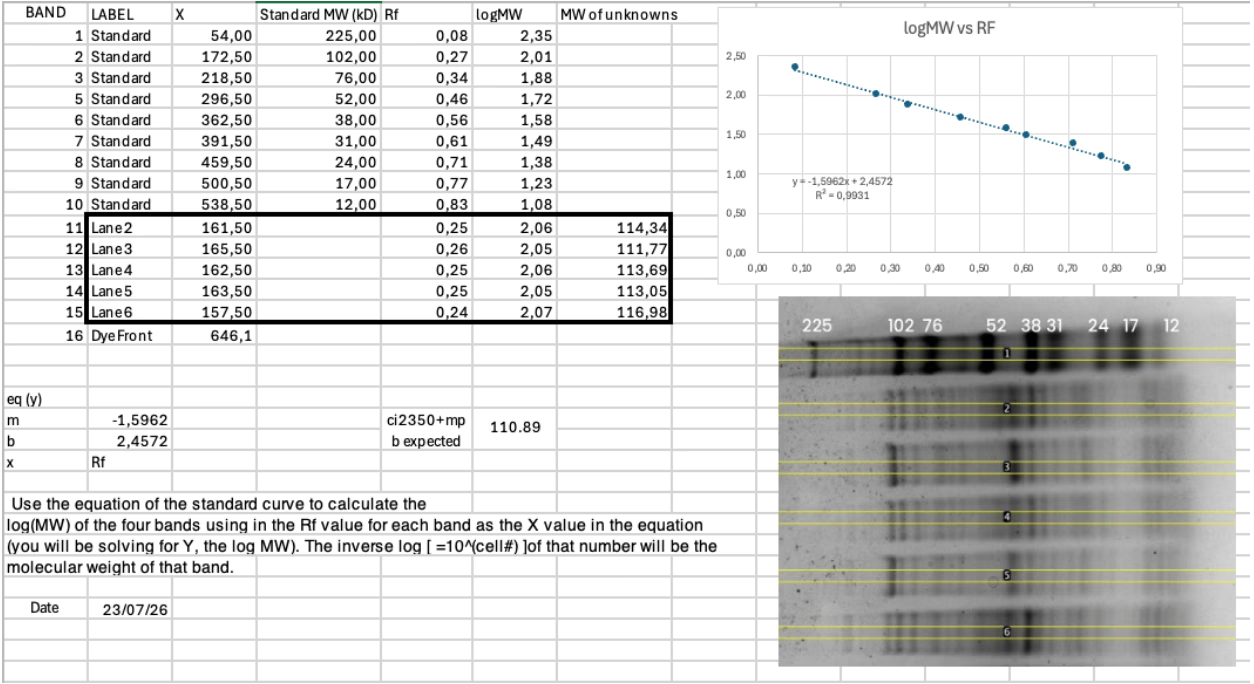
At 0.4 mM IPTG, ci2350-MBP expression was strongest after 3 h at 37 °C and weaker after overnight growth at 25 °C. No 112 kDa band was visible before induction (Notebooks and Protocols › Figure 24).
IMAC purification
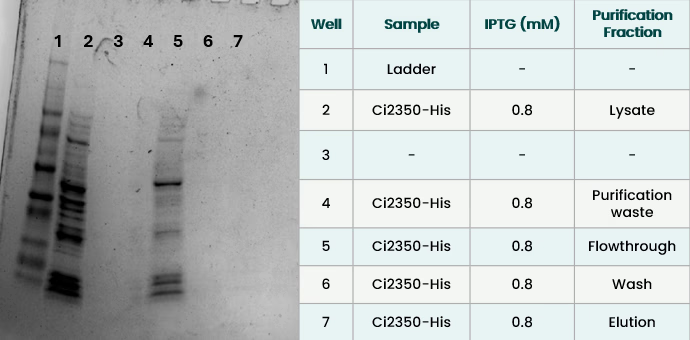
ci2350-6xHis (0.8 mM, 3 h, 37 °C) showed a ~70 kDa band in the flow-through, and the eluate was empty (Notebooks and Protocols › Figure 23). The protein was expressed but did not bind the column. We did not test why. This run is not matched to the MBP runs, which used other temperatures and times.
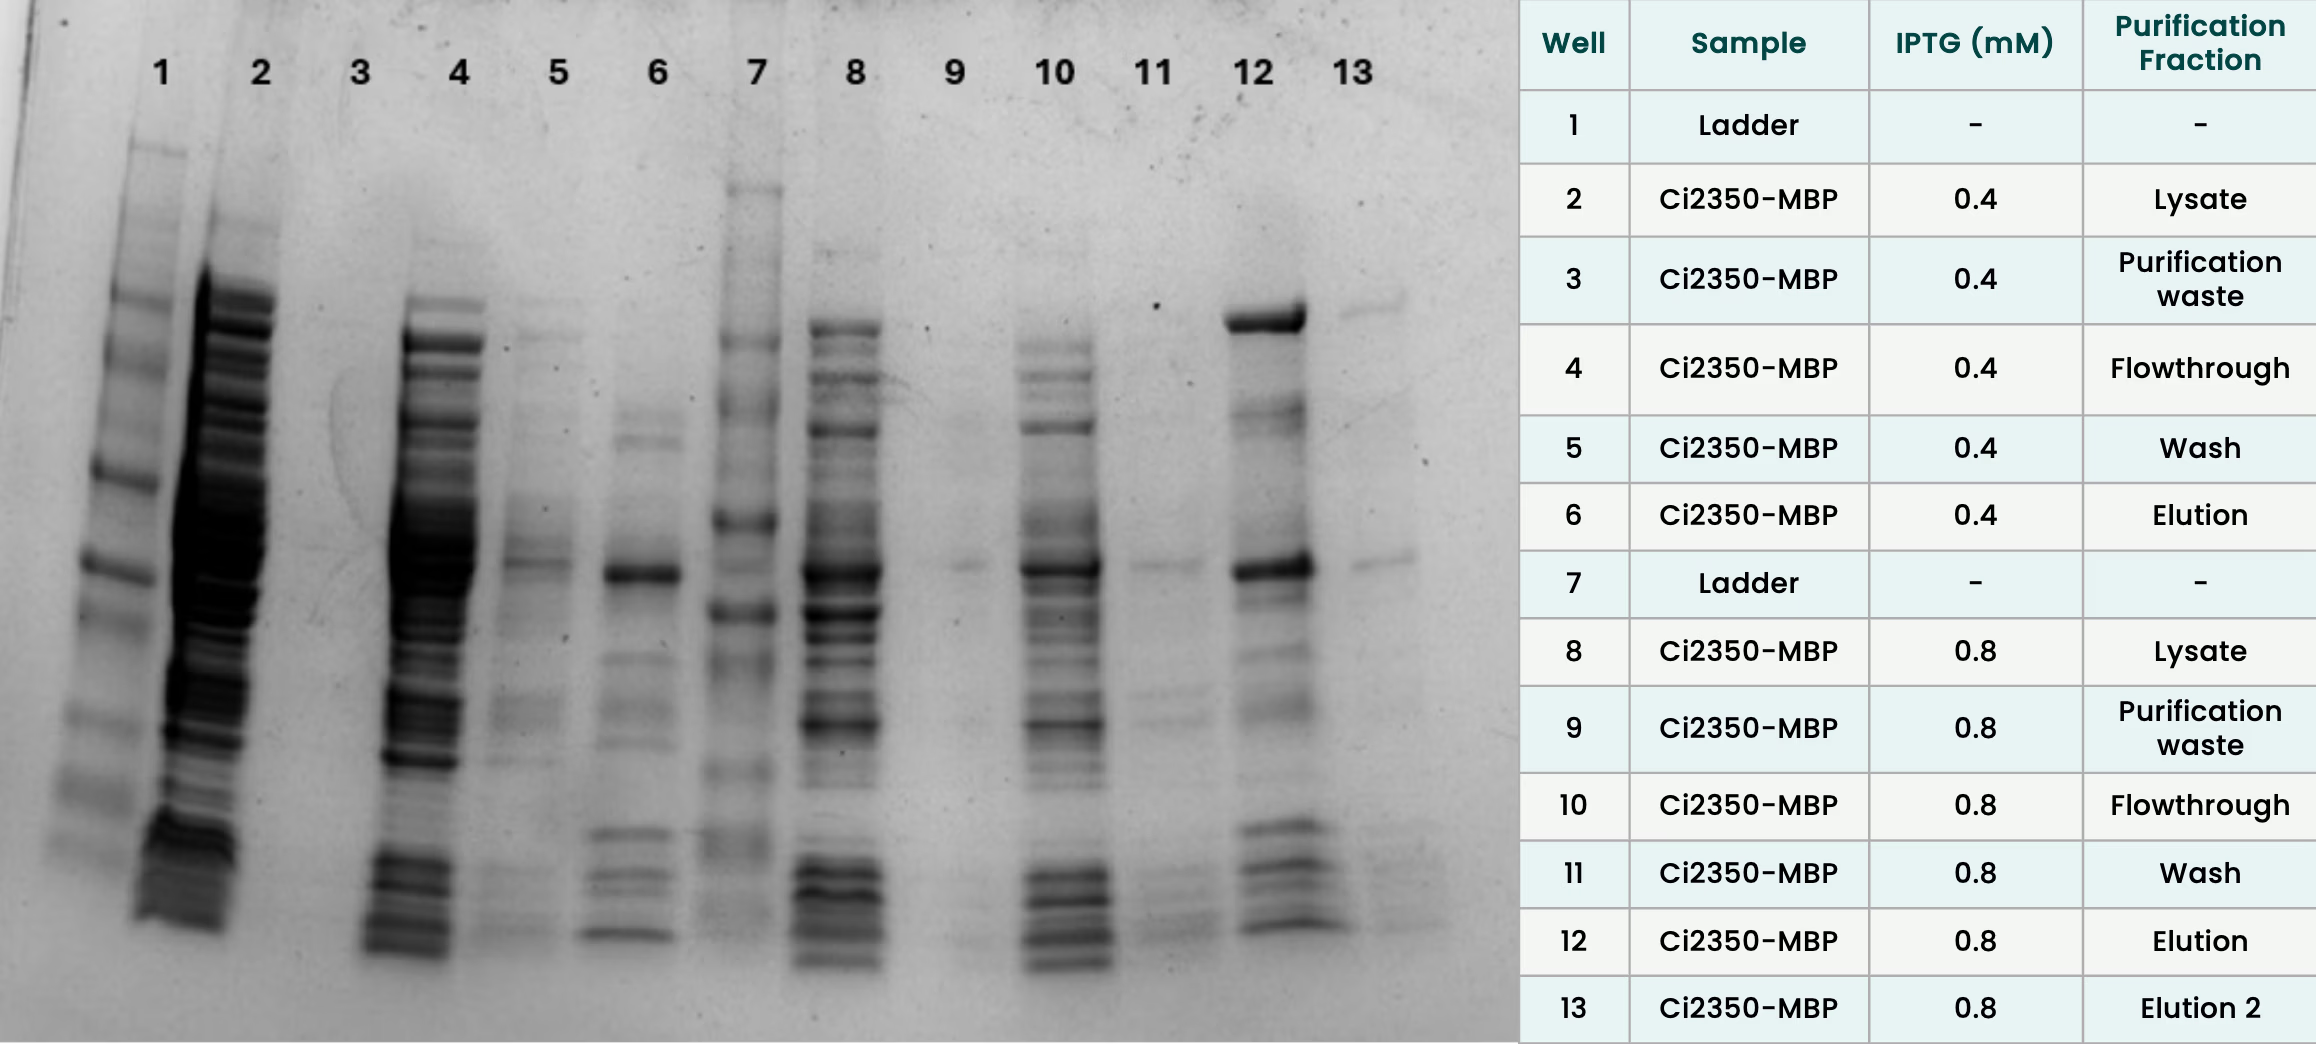
For ci2350-MBP, the eluate from 0.8 mM IPTG at 17 °C overnight had a thick ~112 kDa band. The eluate from 0.4 mM at 37 °C overnight had none (Notebooks and Protocols › Figure 22). Concentrating the 17 °C eluate on a Vivaspin columnA spin filter that concentrates a protein sample by pushing liquid through a membrane that holds the protein back. (30 kDa cut-off) removed most of the 112 kDa band.
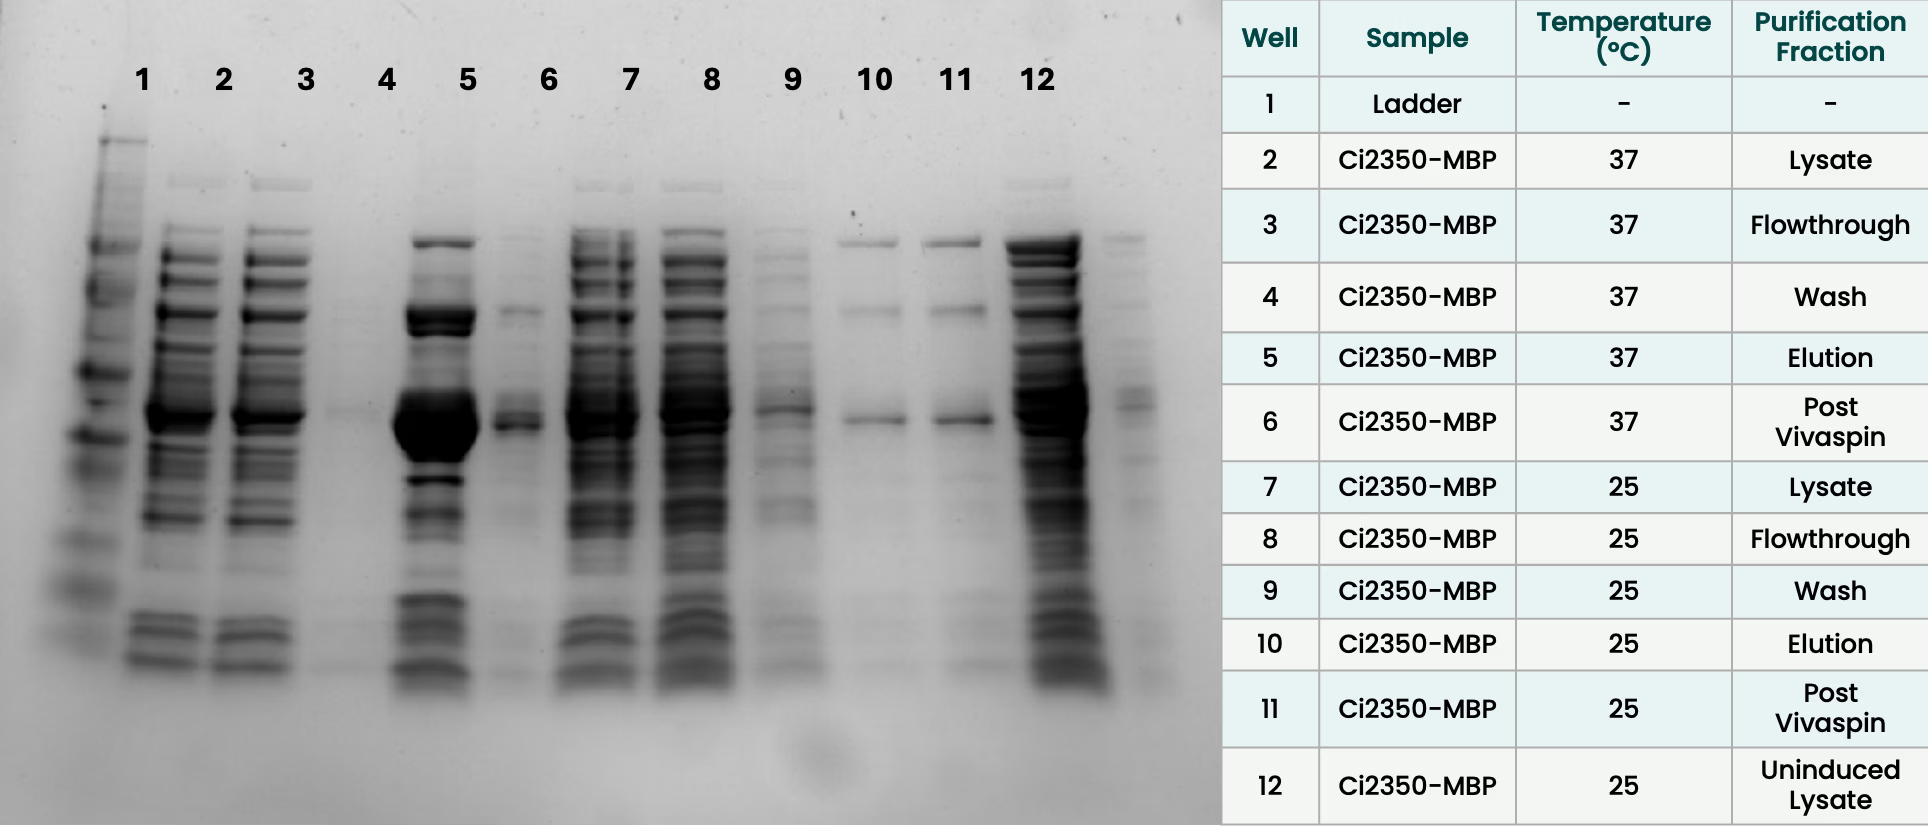
In a second run, 37 °C for 3 h and 25 °C overnight (both 0.4 mM IPTG) were purified one after the other on the same column, with a wash in between (Notebooks and Protocols › Figure 25). Each eluate was run on the gel before and after concentration on a Vivaspin column. Bands read from the gel can be found in Table 7.
| Sample | ~112 kDa band | ~70 kDa band | ~38 kDa band |
|---|---|---|---|
| 37 °C, eluate | small | thick | very heavy |
| 37 °C, after Vivaspin | none | faint | present |
| 25 °C, eluate | present | present | present |
| 25 °C, after Vivaspin | present | present | present |
The 37 °C sample therefore contained ci2350-MBP before the Vivaspin step, but lost it there. The 25 °C sample kept it. We did not identify the cause. The two samples were also treated differently: the 25 °C sample was sonicatedBroken open using ultrasound. in 7 rounds versus 4.
Purity
All eluates contained a ~38 kDa band, and a ~70 kDa band of varying strength (Notebooks and Protocols › Figure 22, Notebooks and Protocols › Figure 25). The ~38 kDa band was also visible before induction in whole cells, was stronger after 3 h at 37 °C, and was almost absent for overnight growth at 25 °C (Notebooks and Protocols › Figure 24). Its identity is unknown. It could be a host protein that binds the Ni column, or a product of ci2350-MBP. We did not test this. Band sizes are estimated from the ladder and can be off by a few kDa. Purified samples were also compared by Bradford (see Table 8).
| Sample | Induction | Protein (mg/mL) |
|---|---|---|
| ci2350-MBP | 0.8 mM IPTG, 17 °C | 1.247 |
| ci2350-MBP double mutant | 0.8 mM IPTG | 0.695 |
| pET-11a empty vector | 0.8 mM IPTG, 17 °C overnight | 0.926 |
| pET-11a empty vector | uninduced, 17 °C overnight | 0.266 |
The induced empty-vector control gave about three quarters as much protein as ci2350-MBP. Much of the protein in our eluates is therefore not full-length ci2350, and BradfordA color-based test for measuring how much protein is in a sample. overstates it. The control was in pET-11a and ci2350-MBP in pET-Blank, so the backbones do not match. We ran no SDS-PAGE on these preparations.
ci2350-MBP (~112 kDa, confirmed at ~114 kDa by standard curve) was expressed in whole cells and recovered by IMAC at 17 °C (0.8 mM IPTG) and 25 °C (0.4 mM), though the band was lost after Vivaspin concentration in both of those conditions; the 25 °C sample retained it. ci2350-6xHis was not detectable at ≤0.4 mM IPTG and failed to bind the Ni column at 0.8 mM. Every eluate contained a persistent ~38 kDa band, visible even before induction, likely a host protein, and a ~70 kDa band of varying strength. The induced empty-vector control gave about three quarters as much protein by Bradford as ci2350-MBP, confirming the preparations were not pure. All gels are single experiments without replicates, so these are observations rather than tested conclusions.
ci2350 double mutant R215A + V263I
Based on the docking results above, R215A + V263I was selected as the priority variant for experimental characterization. The mutations were introduced into the ci2350-MBP-6xHis backbone using inverse PCR site-directed mutagenesis.
The mutagenesis was done sequentially, first performing inverse PCR with one primer pair containing a mutation (V263I_forward & V263I_reverse; R215A_forward & R215A_reverse). The PCR amplification succeeded with the V263I primers, as shown in Figure 34.
Following these results, ci2350-MBP-6xHis sequences with mutation V236I were transformed into E.coli TG1 and sequenced (by Microsynth), which confirmed to have the correct mutation. Then this whole process was repeated, to introduce the R215A mutation, and the double mutated ci2350-MBP-6xHis was confirmed by sequencing (Figure 35 and Figure 36).
The single mutants V263I and R215A were made in Week 31 and sequence-verified in Week 32. The double mutant was built from them, and eight candidates were sequenced. Several carried both mutations, but the reads were incomplete or showed additional changes, and the best candidates still needed resequencing with a ci forward primer to cover the R215A site. The double mutant gave 0.695 mg/mL by Bradford, against 1.247 mg/mL for the wild type (see Table 8). The cultures were grown on different dates, and the double mutant gave less protein than the induced empty-vector control. We therefore cannot say that its yield differs from the wild type.
Developing an enzymatic activity assay
Establishing a reliable spectrophotometric readout
To investigate the testosterone-transforming activity of our candidate enzymes, we developed a continuous spectrophotometric assay based on monitoring reduced-cofactorA small molecule an enzyme needs alongside it to carry out its reaction, here NADPH. absorbance at approximately 340 nm.
Our initial experiments used ci2350–MBP preparations in a microplate format. However, the resulting absorbance traces showed abrupt fluctuations and considerable variability between replicates. Some reactions without protein exhibited larger absorbance decreases than enzyme-containing samples, and increasing protein concentration did not produce a consistent response. Multiple troubleshooting iterations identified errors in reaction preparation, including a tenfold stock-concentration calculation error and visible testosterone precipitation. We corrected the assay composition and improved substrate preparation, after which no visible crystals were observed and the absorbance traces became more stable.
NADPHThe cofactor the enzyme uses to supply hydrogen for the reduction. Its absorbance at 340 nm is what the assay follows. calibration experiments carried out in microplates Figure 37 failed to establish a reproducible and logical relationship between cofactor concentration and absorbance readout. Preparing fresh cofactor did not fully resolve this issue. We therefore switched to a different spectrophotometer and UV-transparent microcuvettesTiny sample holders that let ultraviolet light through, so absorbance at 340 nm can be measured.. Wavelength scansMeasuring how much light a sample absorbs across a range of wavelengths. revealed the expected absorbance peak near 340 nm, confirming that the reduced-cofactor signal could be detected under the revised measurement conditions. Based on these observations, subsequent measurements were performed using cuvettes rather than microplates.
AKR1D1: exploratory measurements
AKR1D1 preparations were also investigated during assay development, including constructs carrying different fusion tags: TrxA and SUMO.
Following the inconsistent results obtained in microplates, we performed further measurements using UV-transparent microcuvettes. Although these experiments allowed us to investigate the behavior of AKR1D1-containing preparations under revised and reliable assay conditions, initial enzyme activity is shown in graphs Figure 38 and Figure 39; at this point only NADPH natural oxidation was monitored as a negative control. Consequently, AKR1D1 measurements have to be considered exploratory as for now we did not establish testosterone-dependent enzymatic activity. All measurements were performed in duplicate and/or triplicate, including negative controls. As we assumed correct enzymatic activity we proceeded with ci2350 enzyme, prioritizing the construct for further assay development. Unlike AKR1D1, ci2350 had not been characterized for testosterone conversion in our experimental system and was also the focus of our computational enzyme-engineering work. This would have allowed us to investigate the experimentally produced ci2350 variants, particularly the R215A + V263I double mutant, with the longer-term objective of evaluating their predicted substrate preferences.
ci2350: Investigating Cofactor Consumption and Background Activity
Previous work identified NADH as a cofactor for ci2350 (Arp et al., 2025),. However, because NADPH was initially the only reduced cofactor available to us, we began our experiments using NADPH. This was an exploratory choice informed by reports of cofactor utilization among related bacterial steroid reductases (Che et al., 2025). Once NADH became available, we incorporated it into subsequent activity measurements.
An important challenge during assay development was determining whether the observed cofactor consumption could be attributed to ci2350 or to other components of the enzyme preparations. We introduced additional controls, based on input from Savvina Leontakianakou (not finished) we decided to introduce two new negative controls, to assess whether enzyme activity could realistically be attributed to our candidate enzyme, data are shown in Figure 40 and Figure 41. The controls include heat-treated assay preparations and material derived from E. coli carrying the empty expression vector. The empty-vector control was used to assess potential background contributions from host-derived proteins or the purification procedure.

Evaluating Testosterone-Associated Cofactor Consumption
In our final NADH-based measurements, we compared ci2350–MBP reactions containing testosterone with corresponding reactions lacking the steroid substrate.
As reported in Figure 43 the testosterone-containing reaction showed a 12.6% decrease in absorbance at 340 nm over 30 minutes. However, the no-substrate control showed a nearly identical decrease of 12.5%. This similarity indicated that most of the observed cofactor consumption was not dependent on the addition of testosterone under the tested conditions. To facilitate comparison, we also expressed the measurements as the change in absorbance relative to the initial value. This transformation removed differences in starting absorbance while preserving the original reaction and control signals.
The resulting traces confirmed that reactions with and without testosterone exhibited comparable decreases, providing no clear evidence of additional testosterone-associated cofactor consumption. These findings were particularly relevant considering the limitations identified during protein purification. Despite IMAC purification and subsequent centrifugal concentration, the resulting preparations contained additional proteins, which may have contributed to background cofactor consumption.
However, the available measurements could not identify the source of this background activity or determine whether ci2350 contributed to the observed signal. The final assay did not provide sufficient evidence to confirm ci2350-dependent testosterone conversion. This means the docking-based predictions of R215A + V263I, which forecast a 2-fold testosterone preference, could not be validated at this stage.
Further work will require improved protein purification, appropriately matched controls, and direct analysis of steroid substrates and products, for example using LC–MS/MSLiquid chromatography with tandem mass spectrometry: separates molecules and identifies them by mass, to measure steroids directly.. Complementary androgen-receptor assaysTests in cells carrying the androgen receptor and a reporter gene that switches on when a molecule activates the receptor. would then be necessary to determine whether any confirmed transformation affects androgenic activity.
Hypoxia-responsive promoter
To implement a safety mechanism that restricts enzyme production to the anaerobic gut environment, we designed hypoxia-inducible constructs for AKR1D1-SUMO-6xHis and ci2350-MBP-6xHis. These constructs placed enzyme expression under the control of the hypoxia-responsive promoter PfnrS (BBa_25DMNRIB), and the lambda t0 terminatorA DNA sequence that tells the cell's machinery to stop copying the gene. (BBa_26P9V9ID), ensuring production would only occur in low-oxygen conditions typical of the intestinal tract.
Both constructs were ordered as clonal genes from Twist Bioscience, synthesized directly into the pET-Blank-Amp backbone with a custom promoter-RBS region containing PfnrS, spacer after it, and RBSRibosome binding site: where the ribosome attaches to the mRNA to start making protein. (Figure 44 and Figure 45).
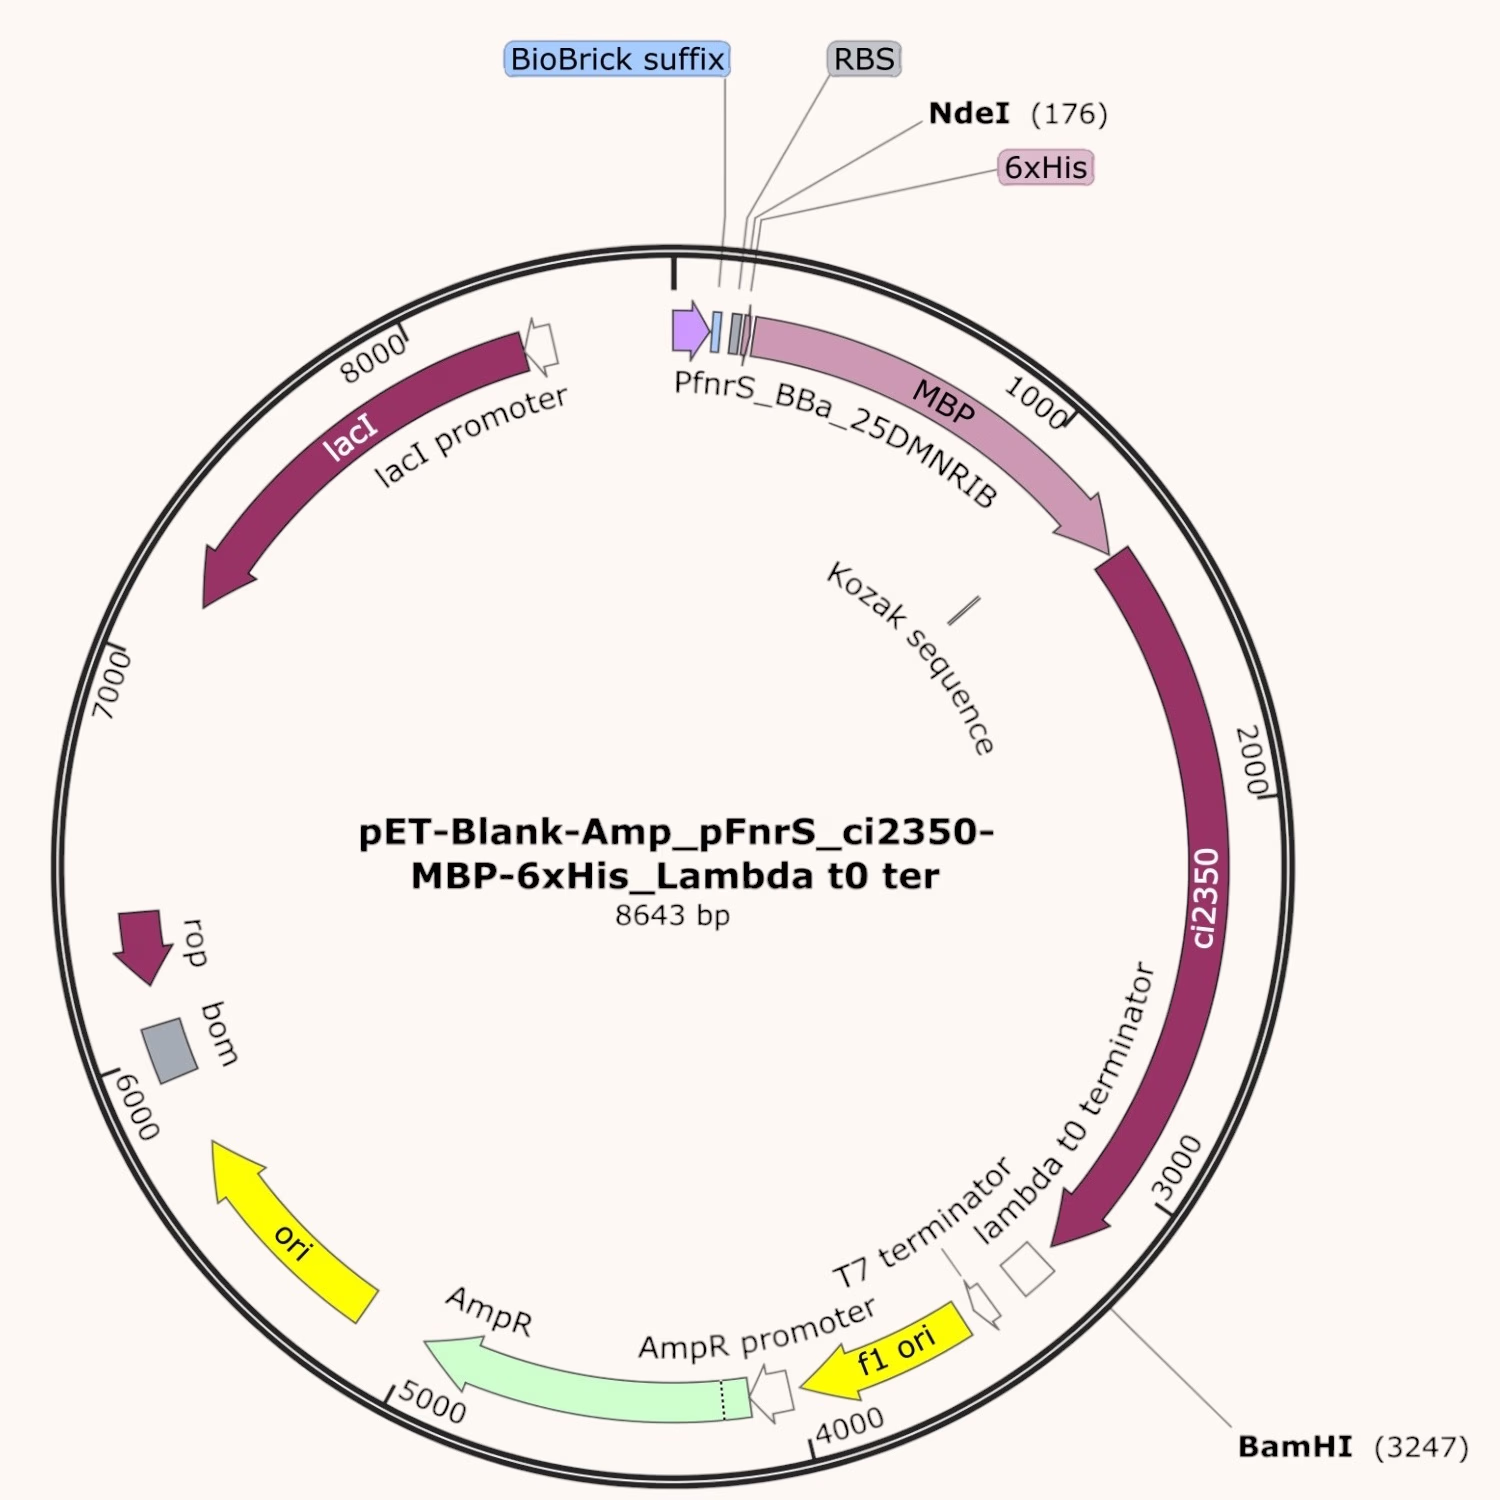
We successfully transformed both constructs into E. coli TG1. However, due to time constraints, we were unable to perform protein expression analysis or test hypoxia-induced production.
References
- Arp, G., Jiang, A. K., Dufault-Thompson, K., Levy, S., Zhong, A., Wassan, J. T., Grant, M. R., Li, Y., Hall, B., & Jiang, X. (2025). Identification of gut bacteria reductases that biotransform steroid hormones. Nature Communications, 16(1). https://doi.org/10.1038/s41467-025-61425-6
- Che, C., Zhang, W., Qiu, X., Wang, Q., Tang, L., Qin, B., Jia, X., & You, S. (2025). Engineered bacterial progesterone 5β-reductase: Tunable substrate preference and synthesis of 5β-dihydrosteroids. ACS Catalysis, 15(19), 16560–16573. https://doi.org/10.1021/acscatal.5c04685